> ## Documentation Index
> Fetch the complete documentation index at: https://docs.asapp.com/llms.txt
> Use this file to discover all available pages before exploring further.
# Dashboards
> Monitor GenerativeAgent's performance, quality, and operational health in one place.
Dashboards give Builders and Business Owners a real-time view of how GenerativeAgent is performing across your contact center.
Use them to track containment, spot quality issues, understand escalation patterns, and make faster decisions about your GenerativeAgent deployment.
## Access Dashboards
Sign in to CXP with your ASAPP credentials.
From the left-hand menu, select **Dashboards** under the **Monitor** section.
Choose the dashboard you want to view from the list of available dashboards.
Each dashboard answers a different question about your deployment, from overall containment down to the health of individual functions and Knowledge Base content.
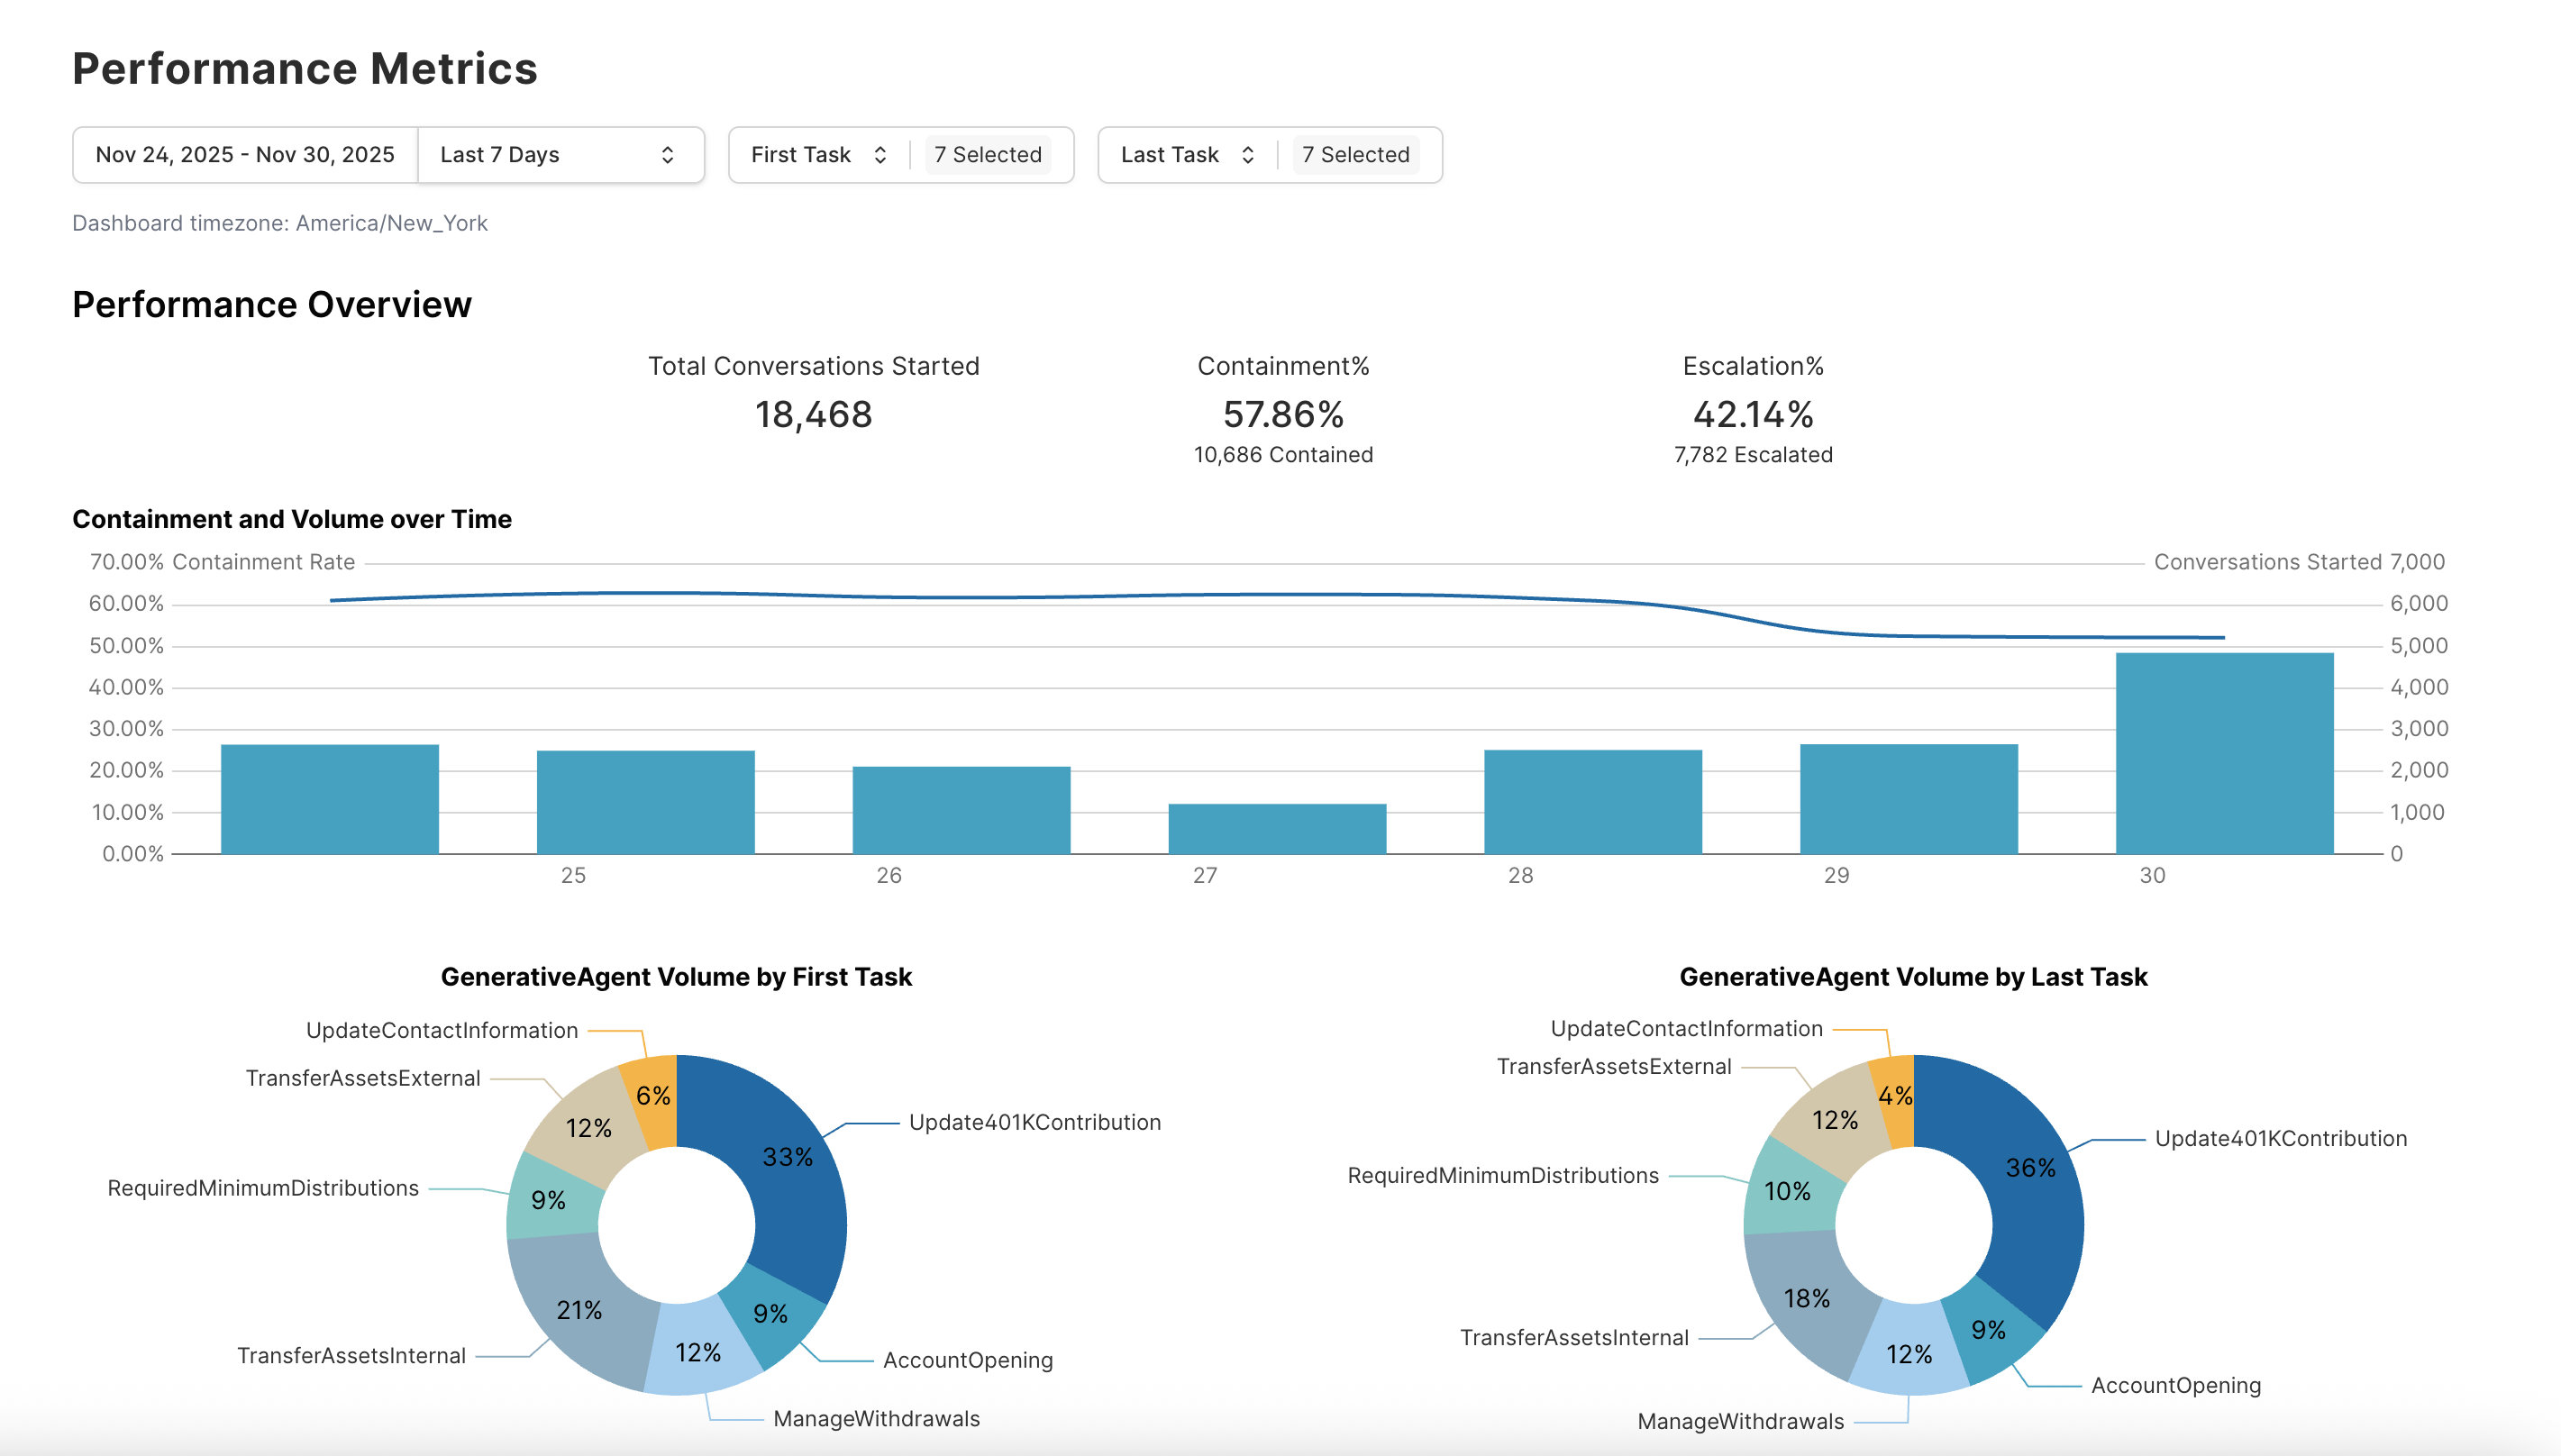
A high-level view of GenerativeAgent's business impact: containment, rep opportunity, and total conversations started.
Containment and volume are tracked over time and broken down by intent, first task, and last task.
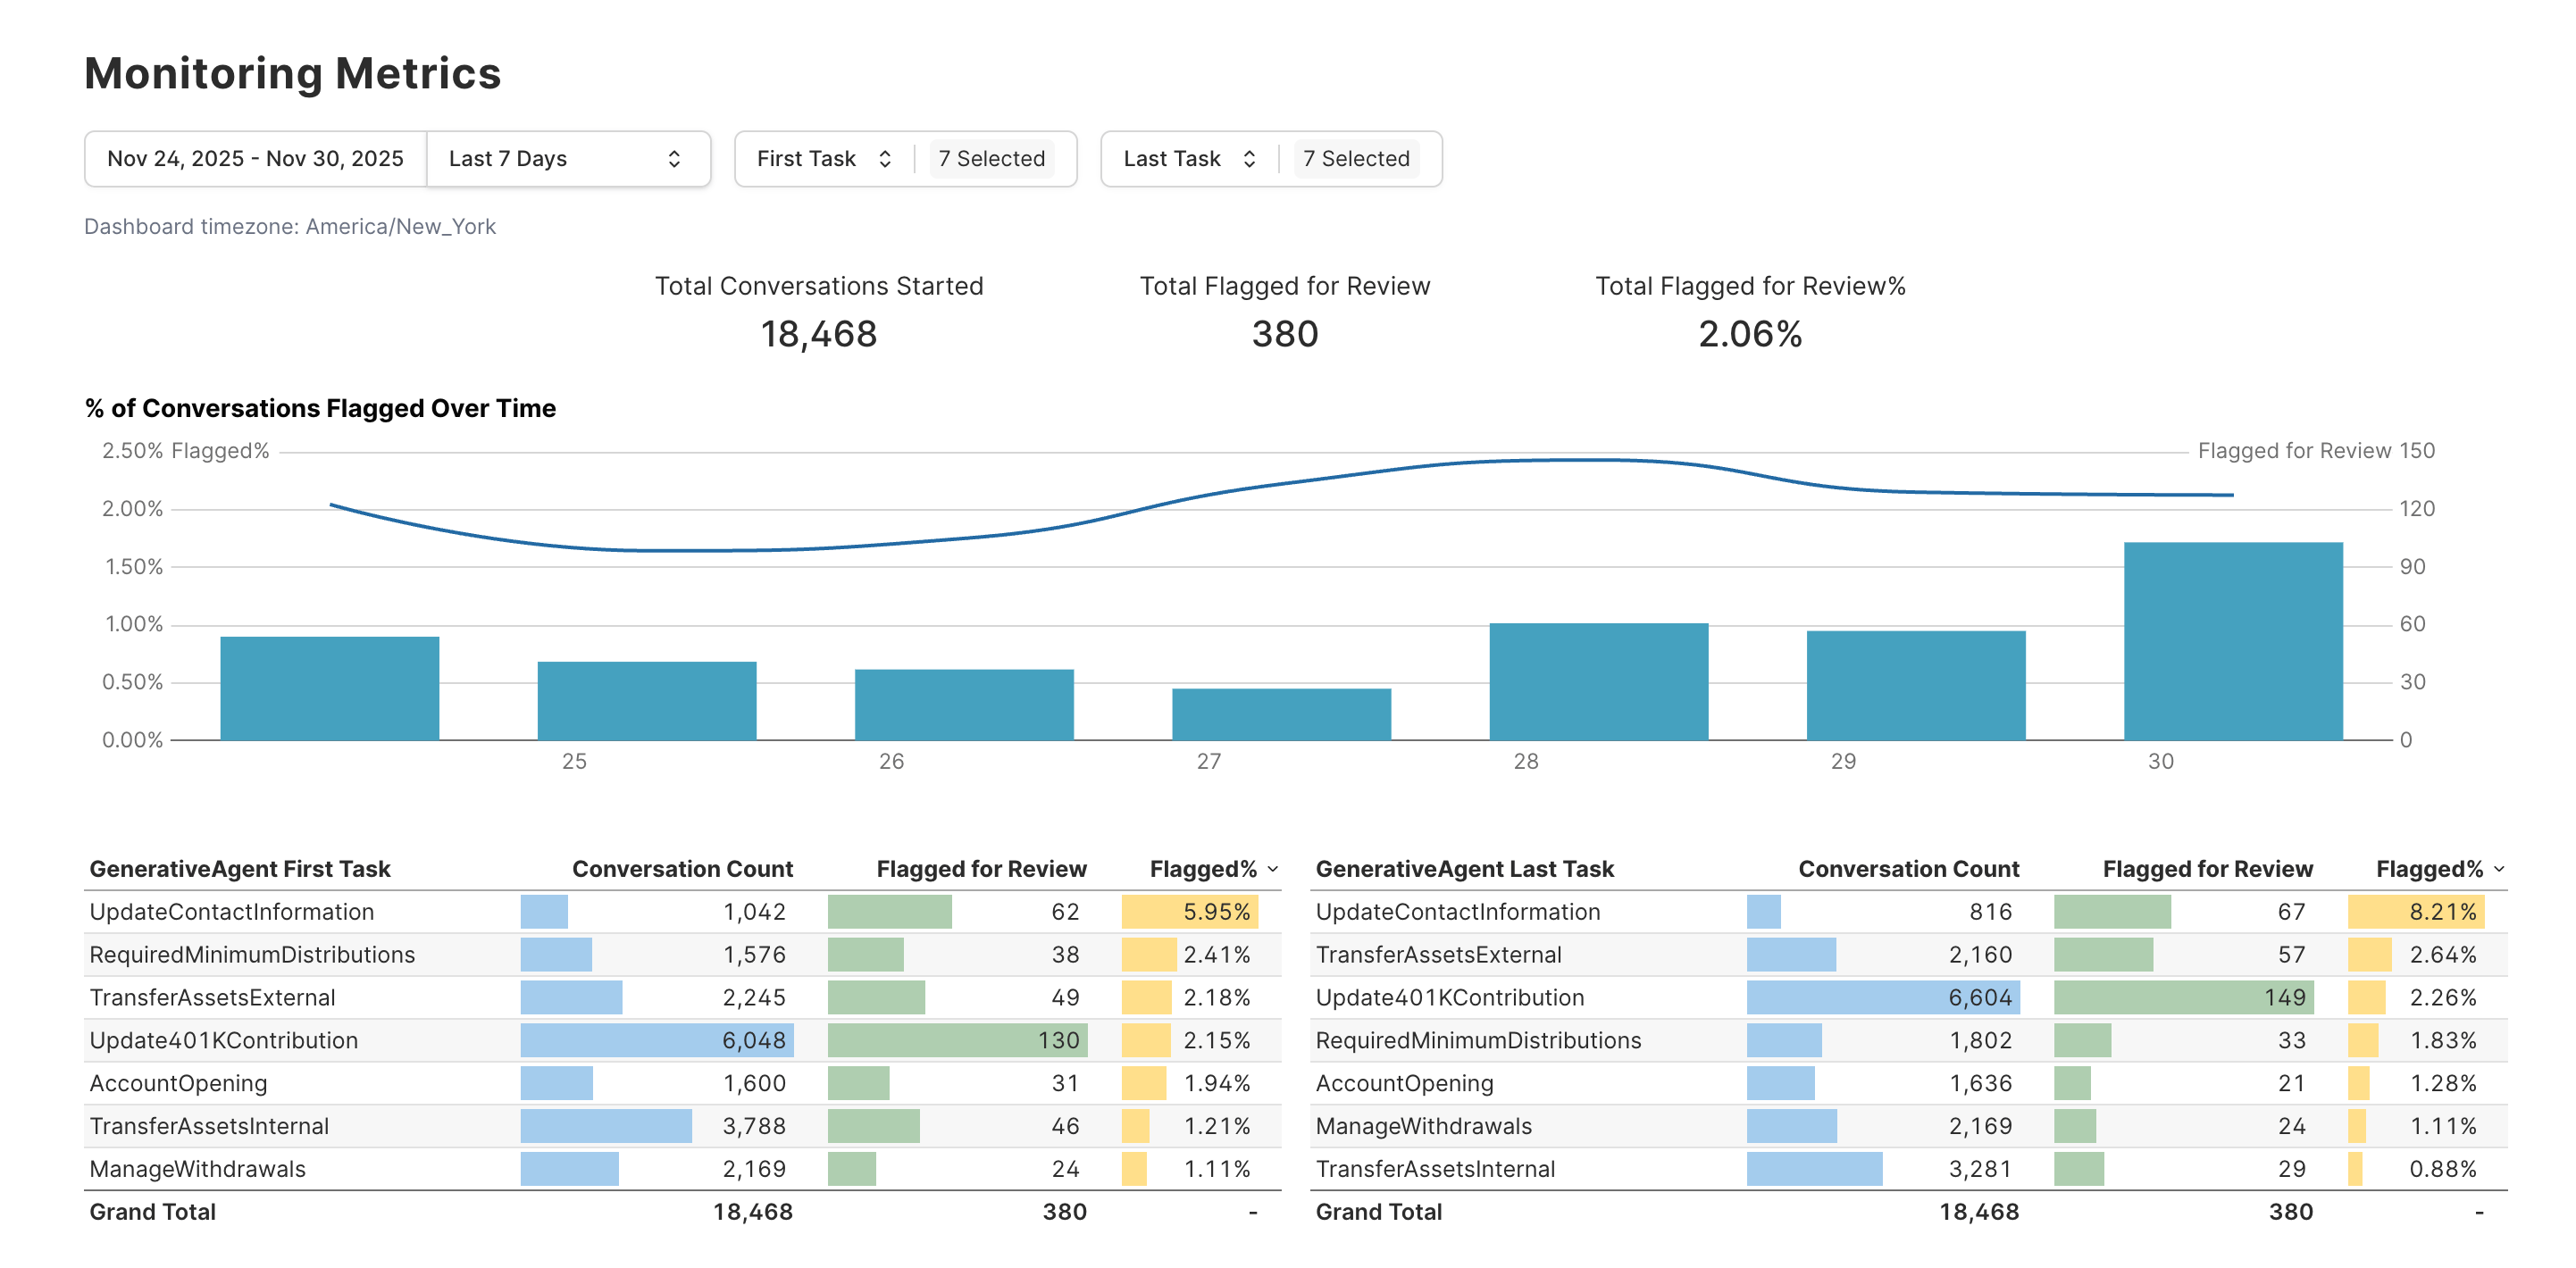
 This dashboard shows conversations flagged by automated quality evaluators, grouped by flag category and intent. Filter by severity level, major or critical, to focus on the most pressing issues. Minor flags are not shown by default.
Use this dashboard to identify which tasks generate the most quality flags and prioritize your optimization work accordingly.
See [Conversation Monitoring](/generativeagent/observe/evaluators/conversation-monitoring) for more detail on how flags are generated.
This dashboard shows conversations flagged by automated quality evaluators, grouped by flag category and intent. Filter by severity level, major or critical, to focus on the most pressing issues. Minor flags are not shown by default.
Use this dashboard to identify which tasks generate the most quality flags and prioritize your optimization work accordingly.
See [Conversation Monitoring](/generativeagent/observe/evaluators/conversation-monitoring) for more detail on how flags are generated.
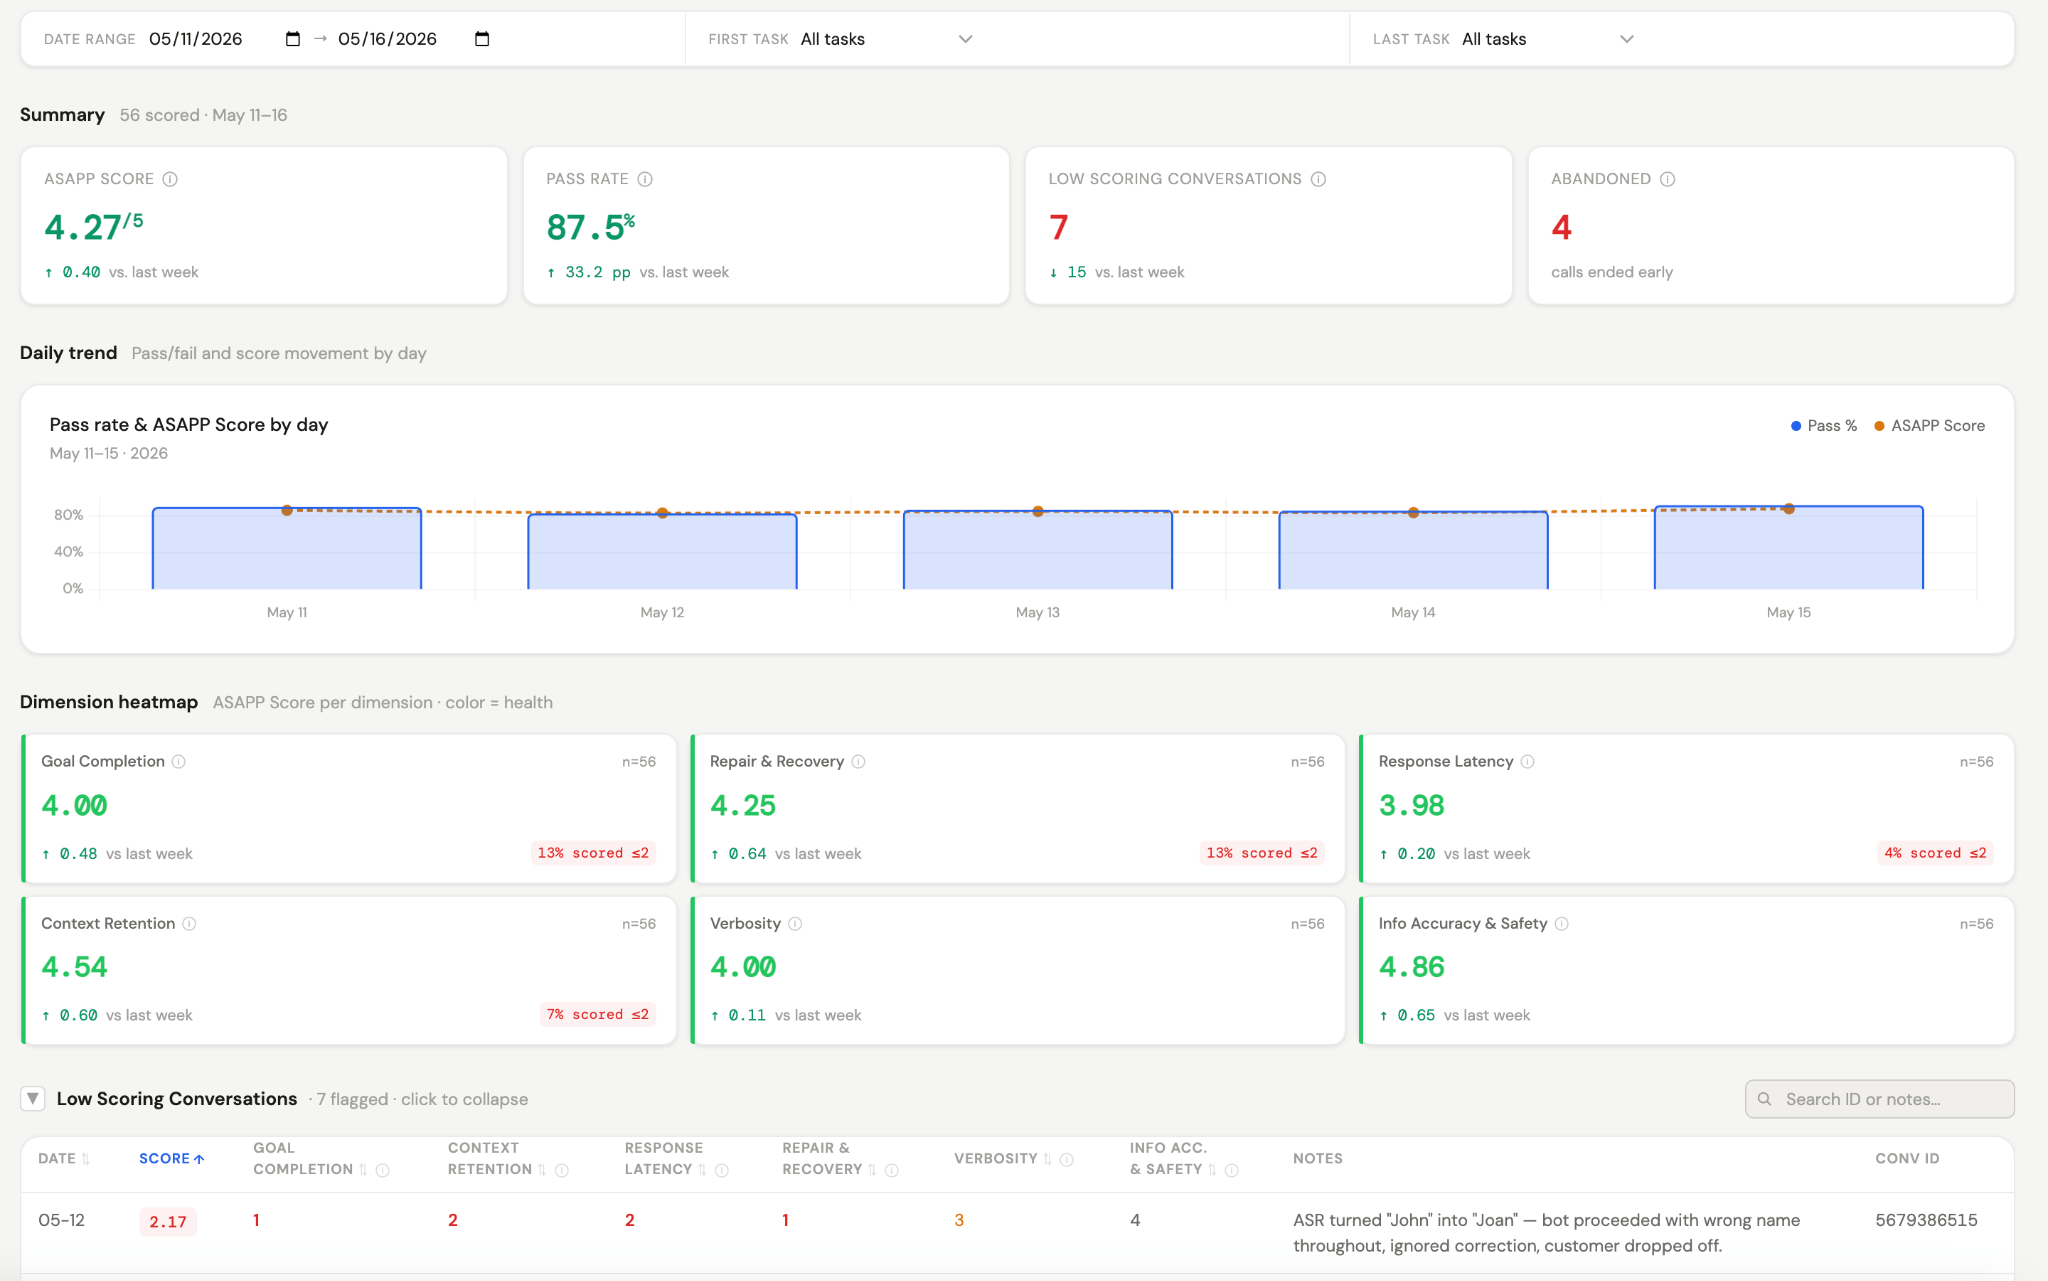
 Every conversation is automatically scored against a standardized rubric and rolled up into a daily report showing the ASAPP Score, pass/fail rate, and low-scoring conversations.
See [Quality Reports](/generativeagent/observe/evaluators/quality-reports) for the scoring dimensions and how the score is calculated.
Every conversation is automatically scored against a standardized rubric and rolled up into a daily report showing the ASAPP Score, pass/fail rate, and low-scoring conversations.
See [Quality Reports](/generativeagent/observe/evaluators/quality-reports) for the scoring dimensions and how the score is calculated.
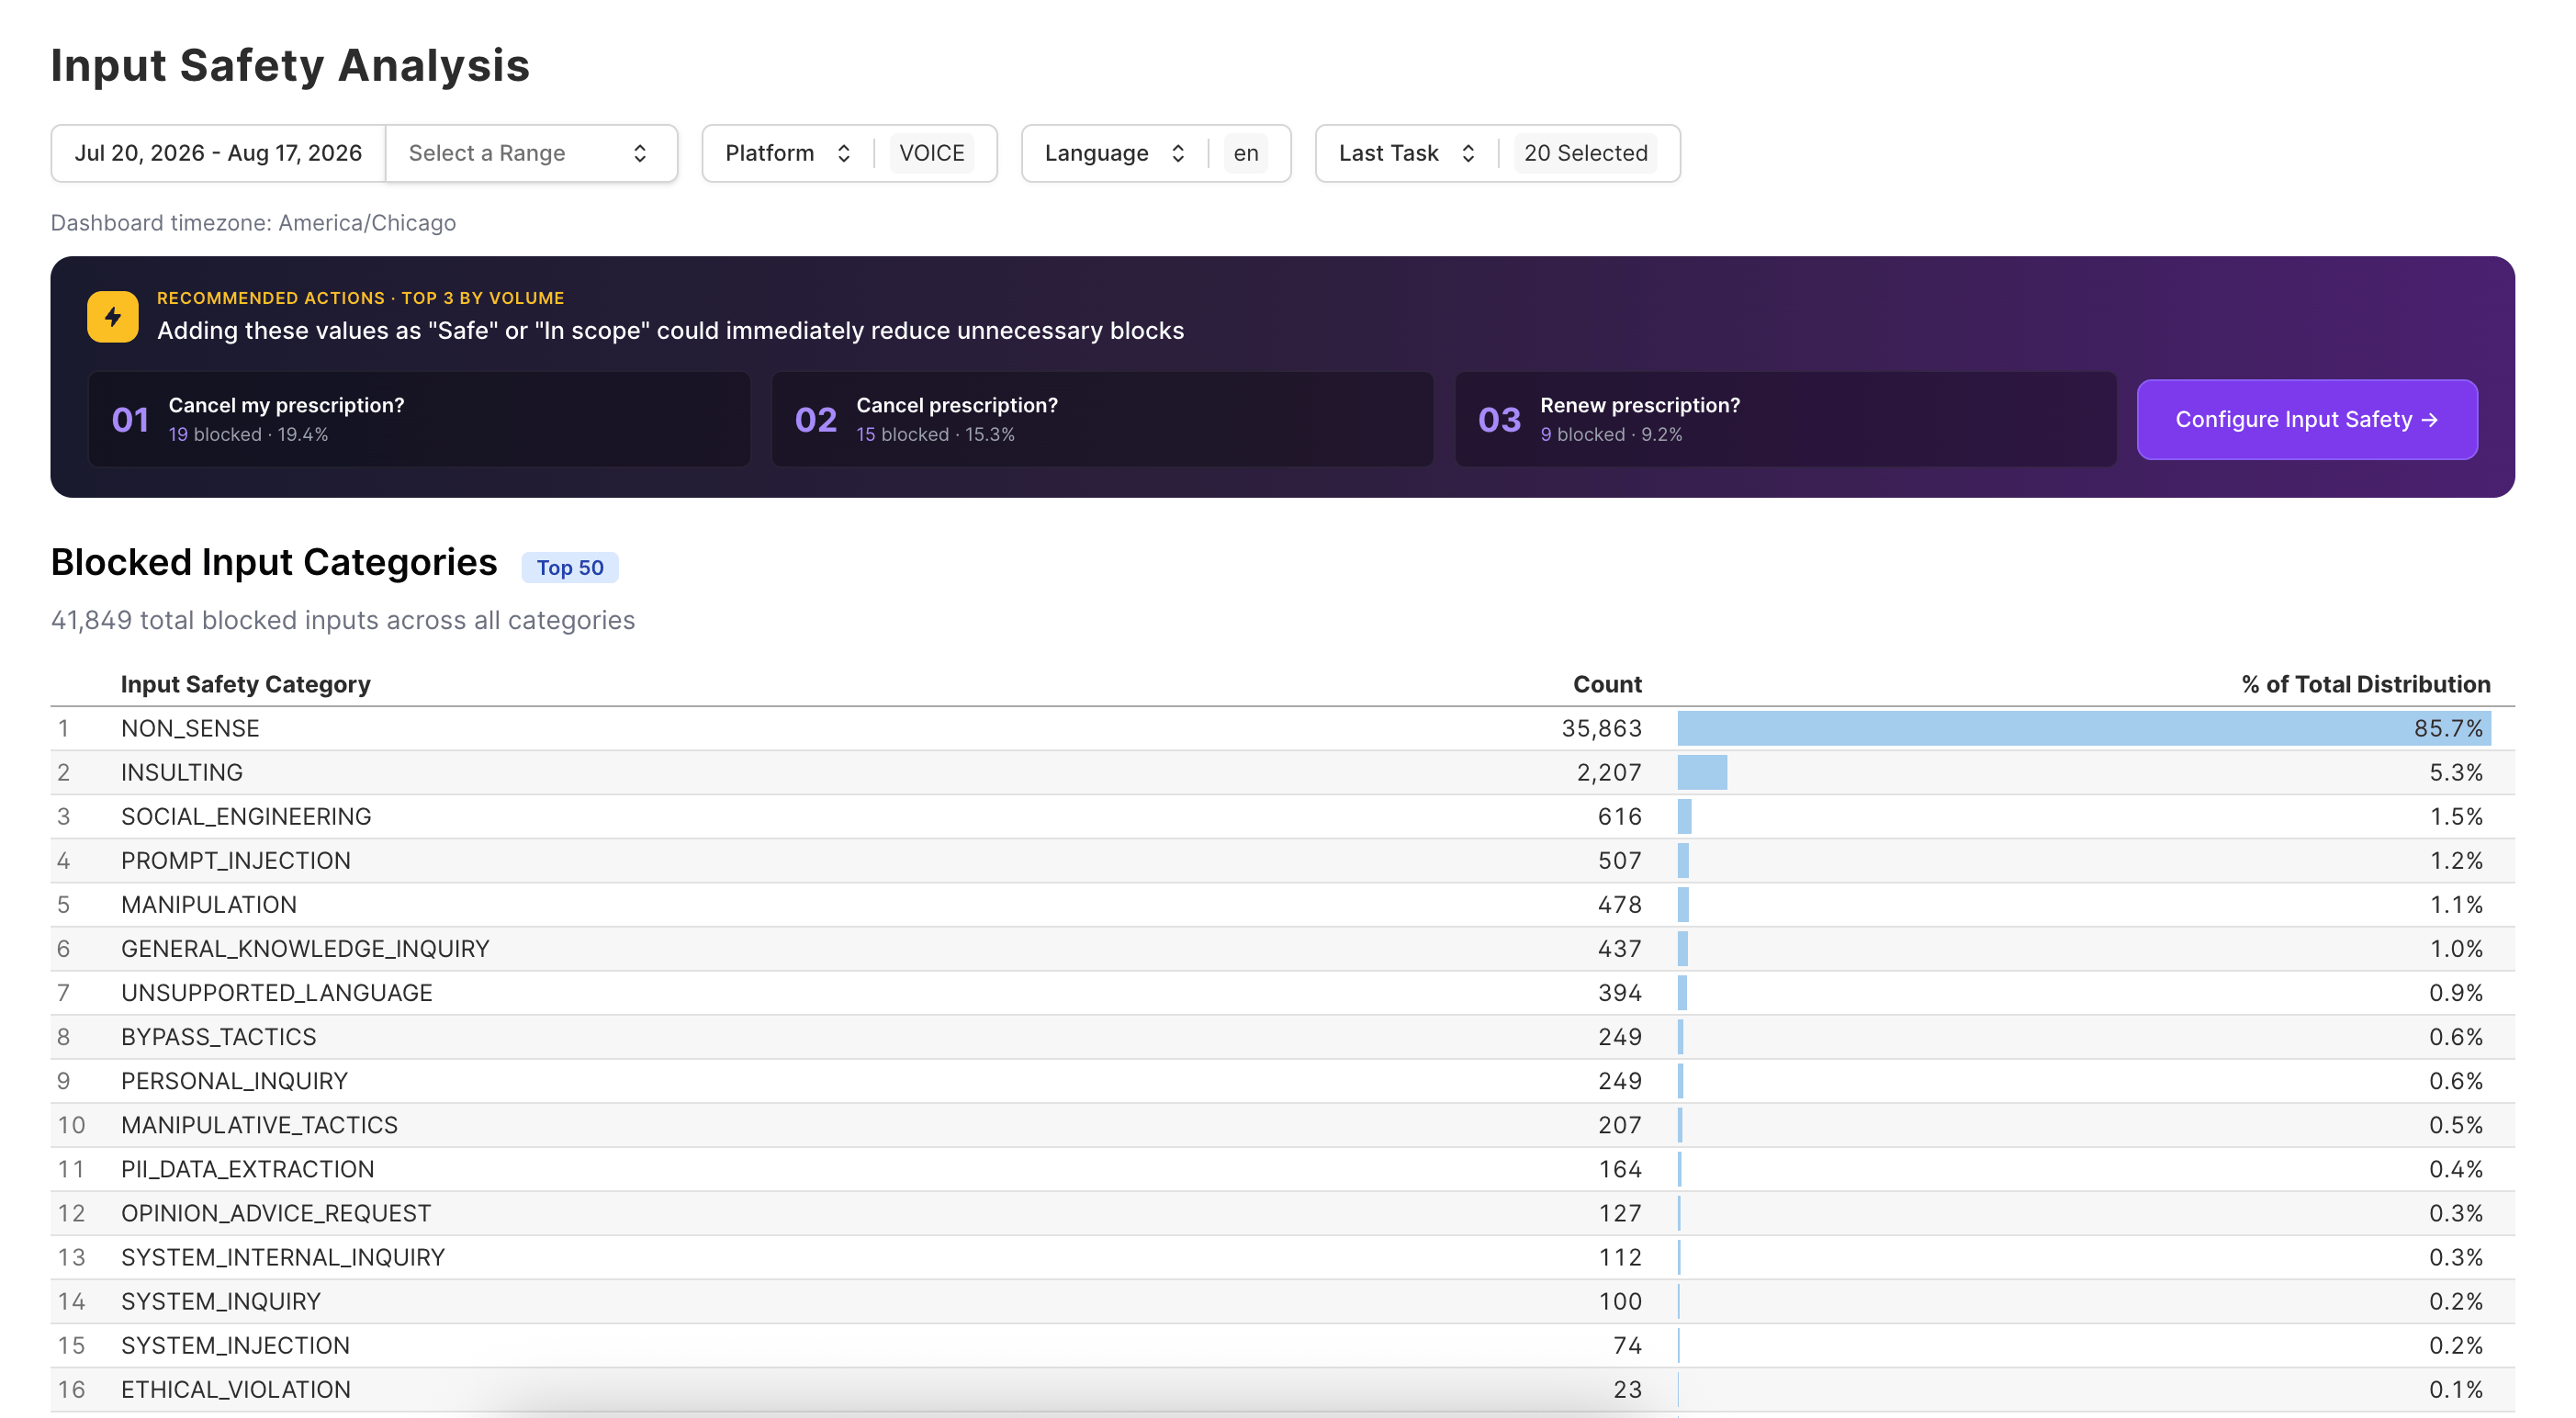
 This dashboard shows the reasons GenerativeAgent blocked conversations before responding, broken down by category. It includes:
* A table view of block category, count, and percentage
* A trend of the overall Input Safety block rate over time, and by category
Use this dashboard to identify gaps in your Input Safety configuration that may be blocking conversations GenerativeAgent could otherwise handle.
This dashboard shows the reasons GenerativeAgent blocked conversations before responding, broken down by category. It includes:
* A table view of block category, count, and percentage
* A trend of the overall Input Safety block rate over time, and by category
Use this dashboard to identify gaps in your Input Safety configuration that may be blocking conversations GenerativeAgent could otherwise handle.
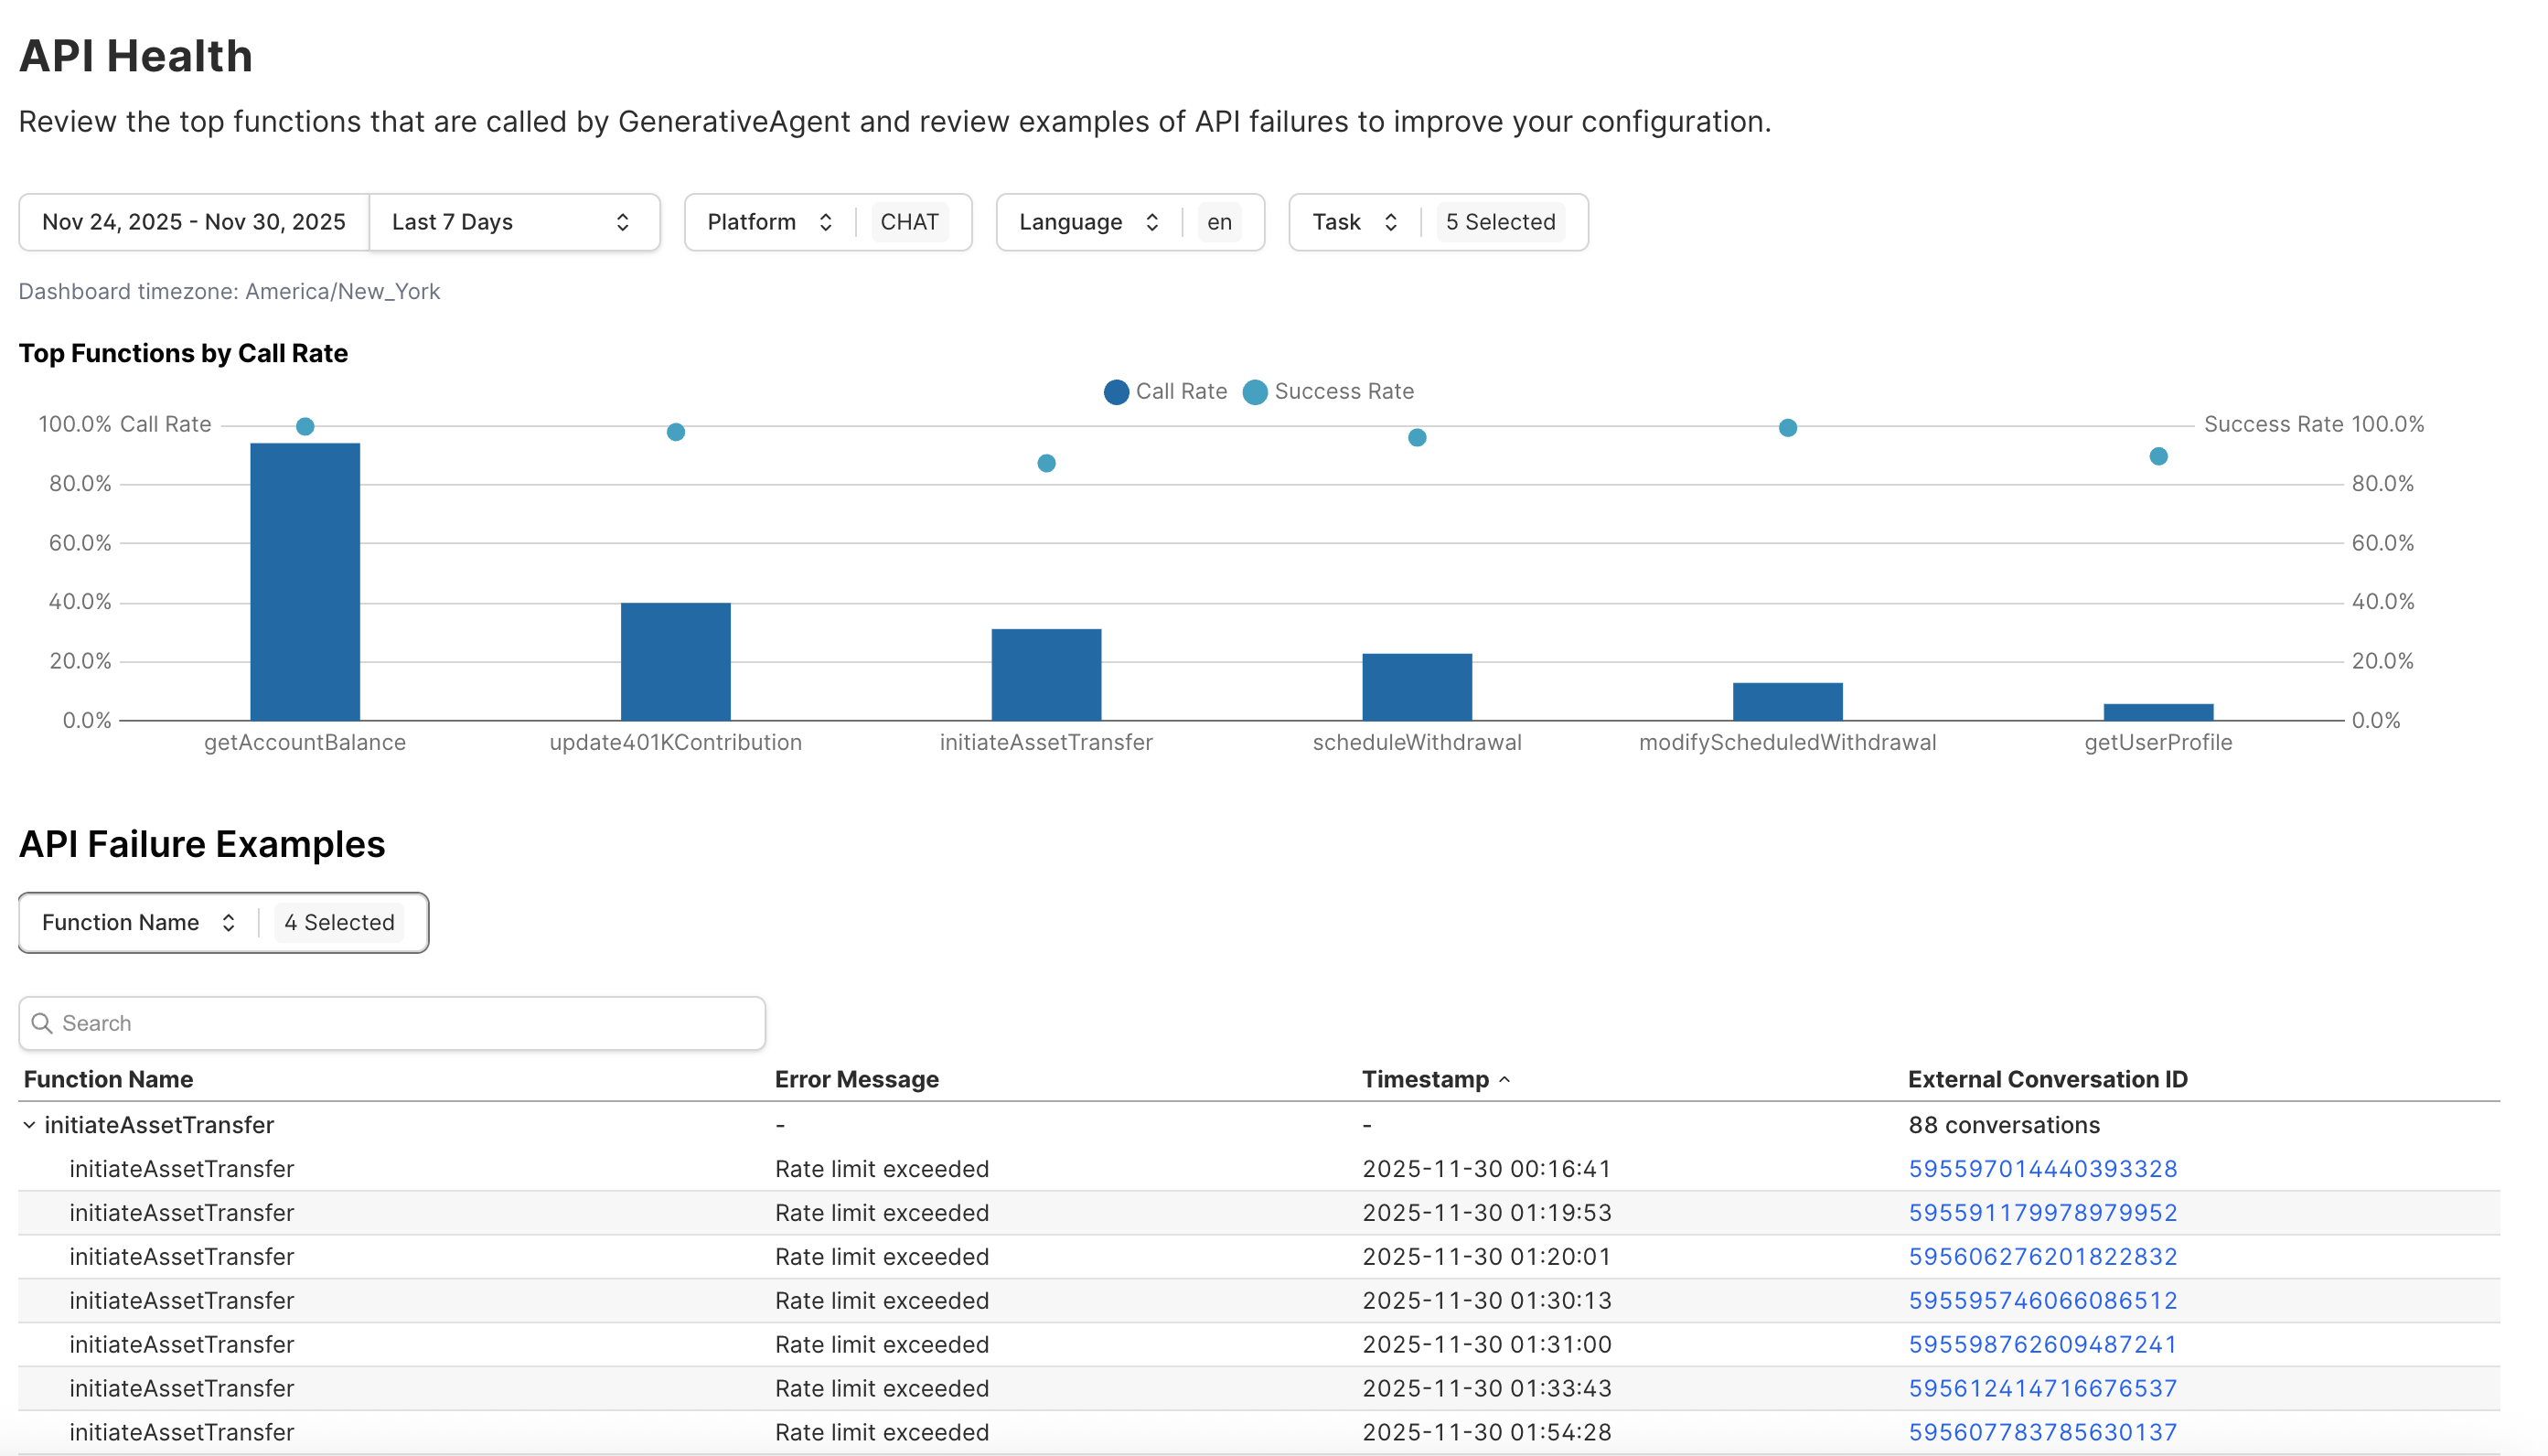
 This dashboard shows the status and outcomes of API, or function, calls made by GenerativeAgent during conversations. Use it to identify functions that are failing or returning unexpected responses.
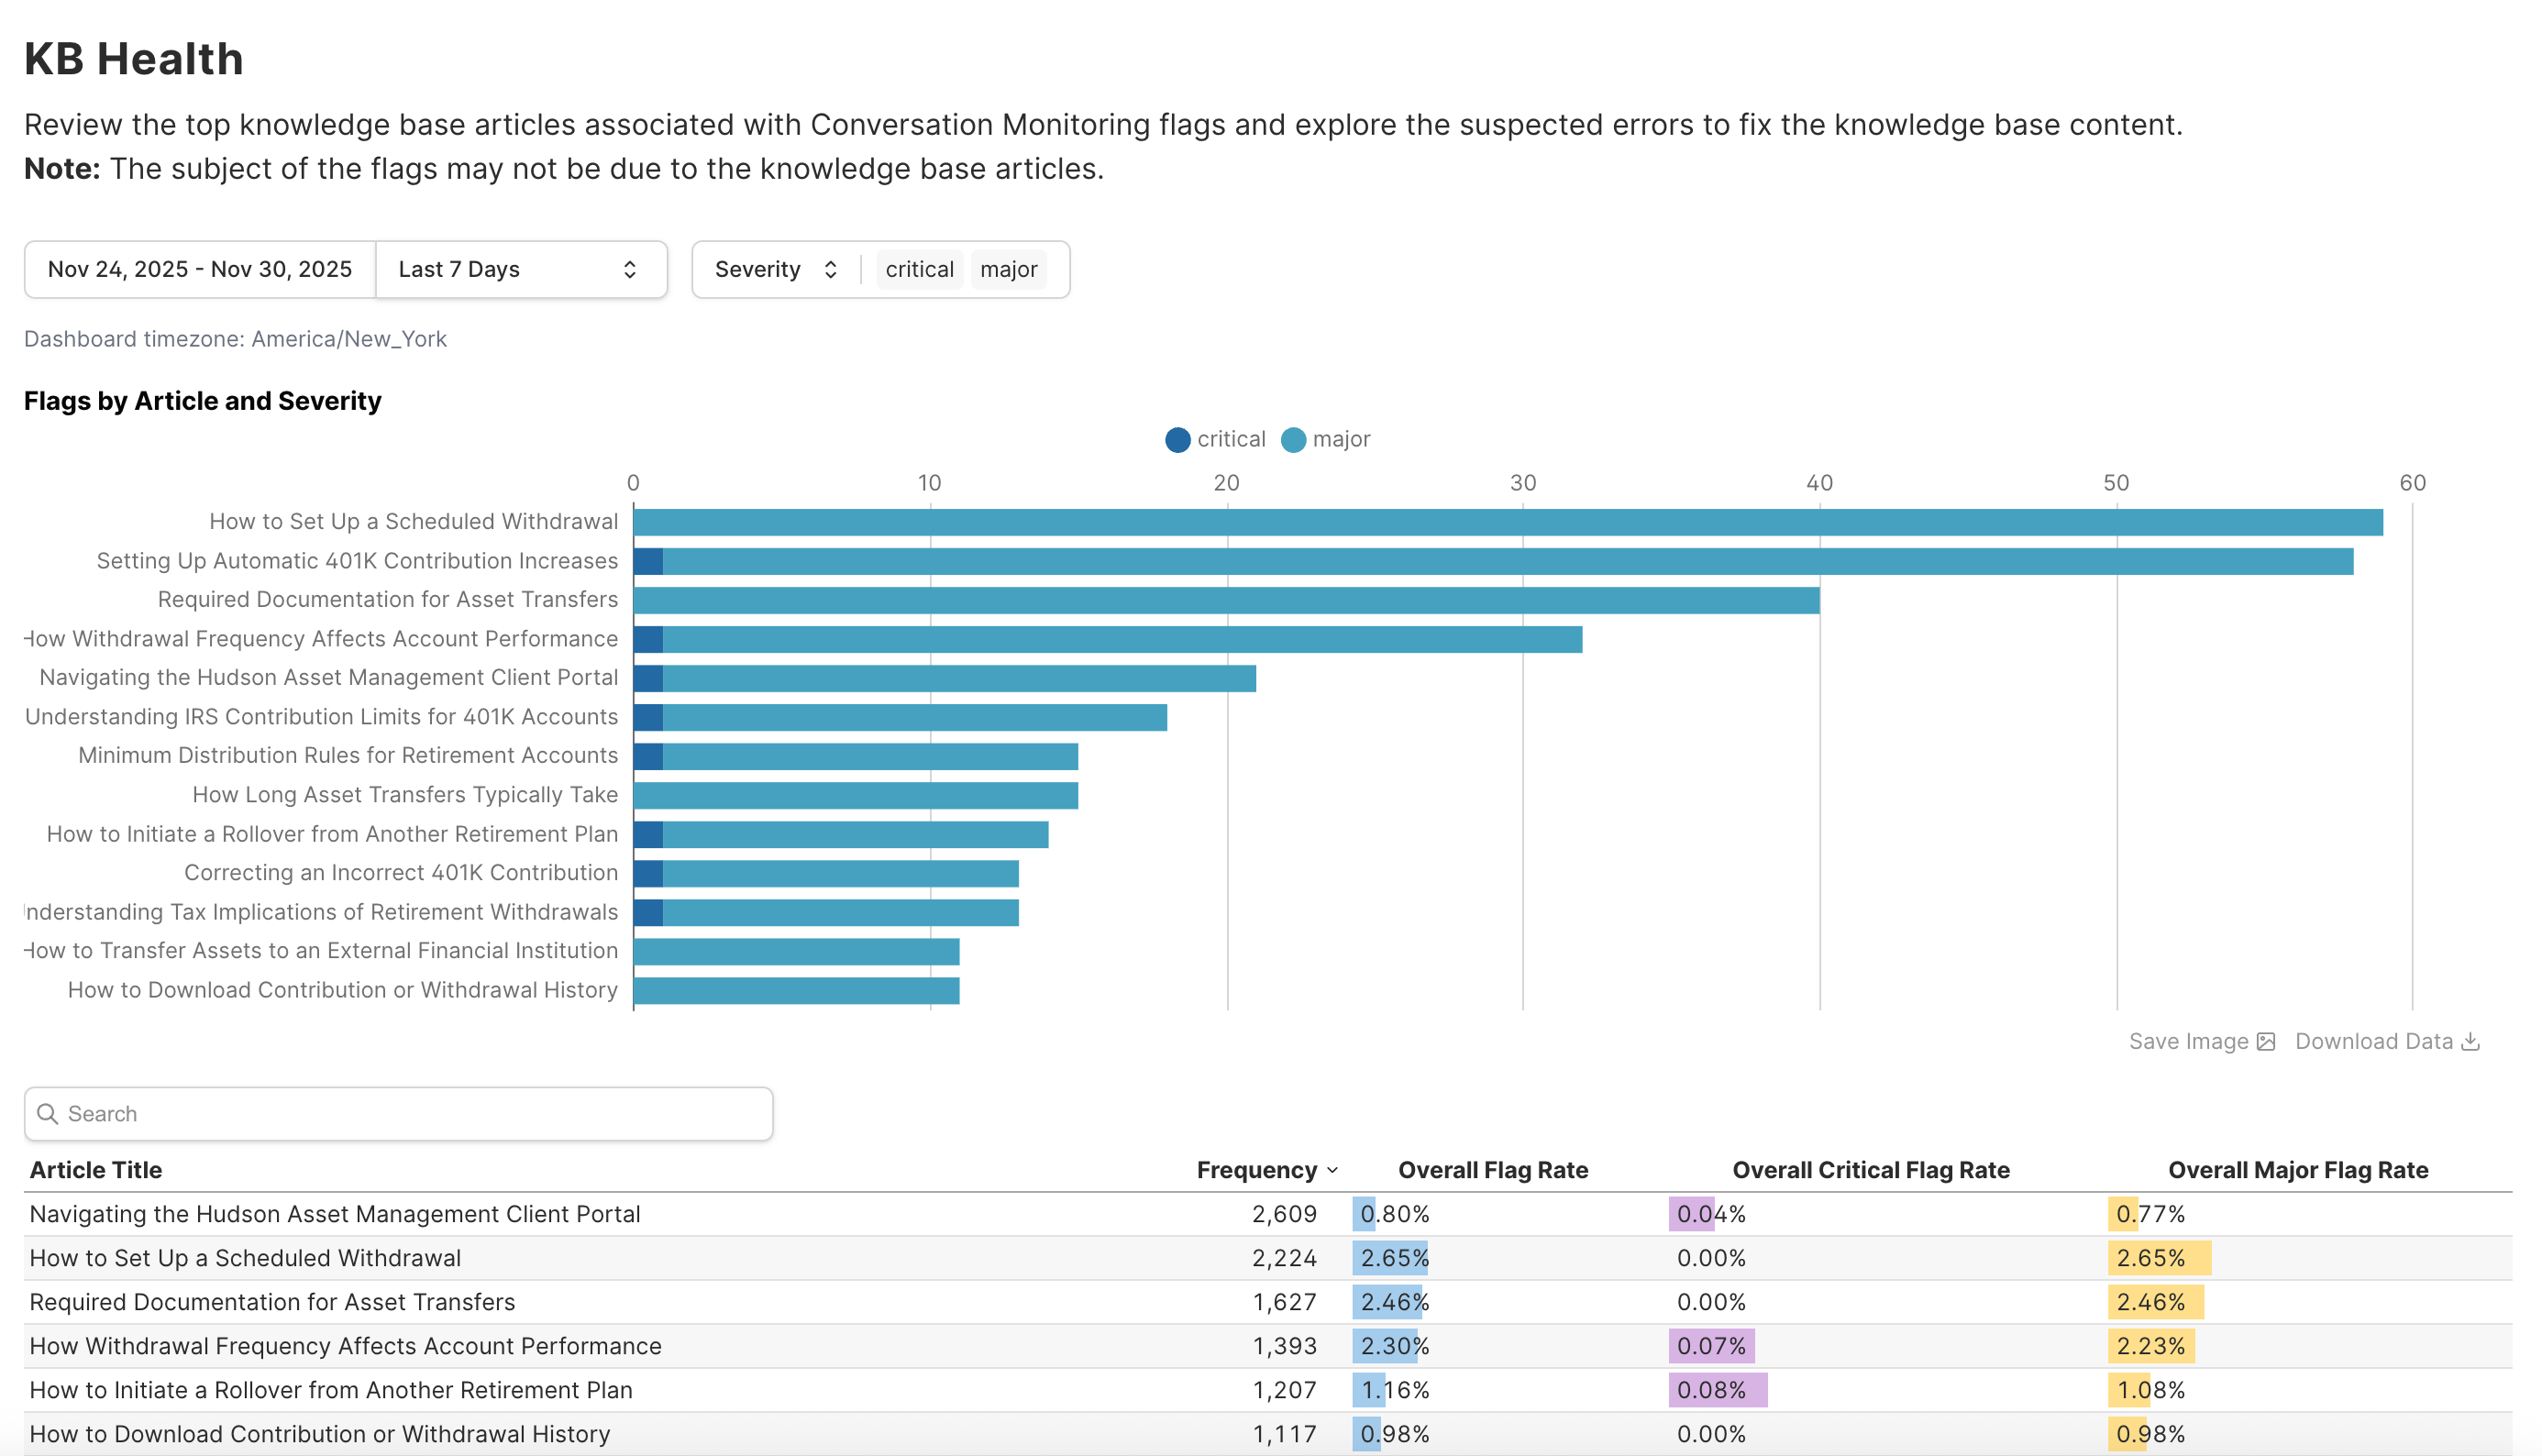
 This dashboard shows how GenerativeAgent is referencing your Knowledge Base. It also surfaces cases where conversation flags indicate that Knowledge Base content may have been referenced inaccurately.
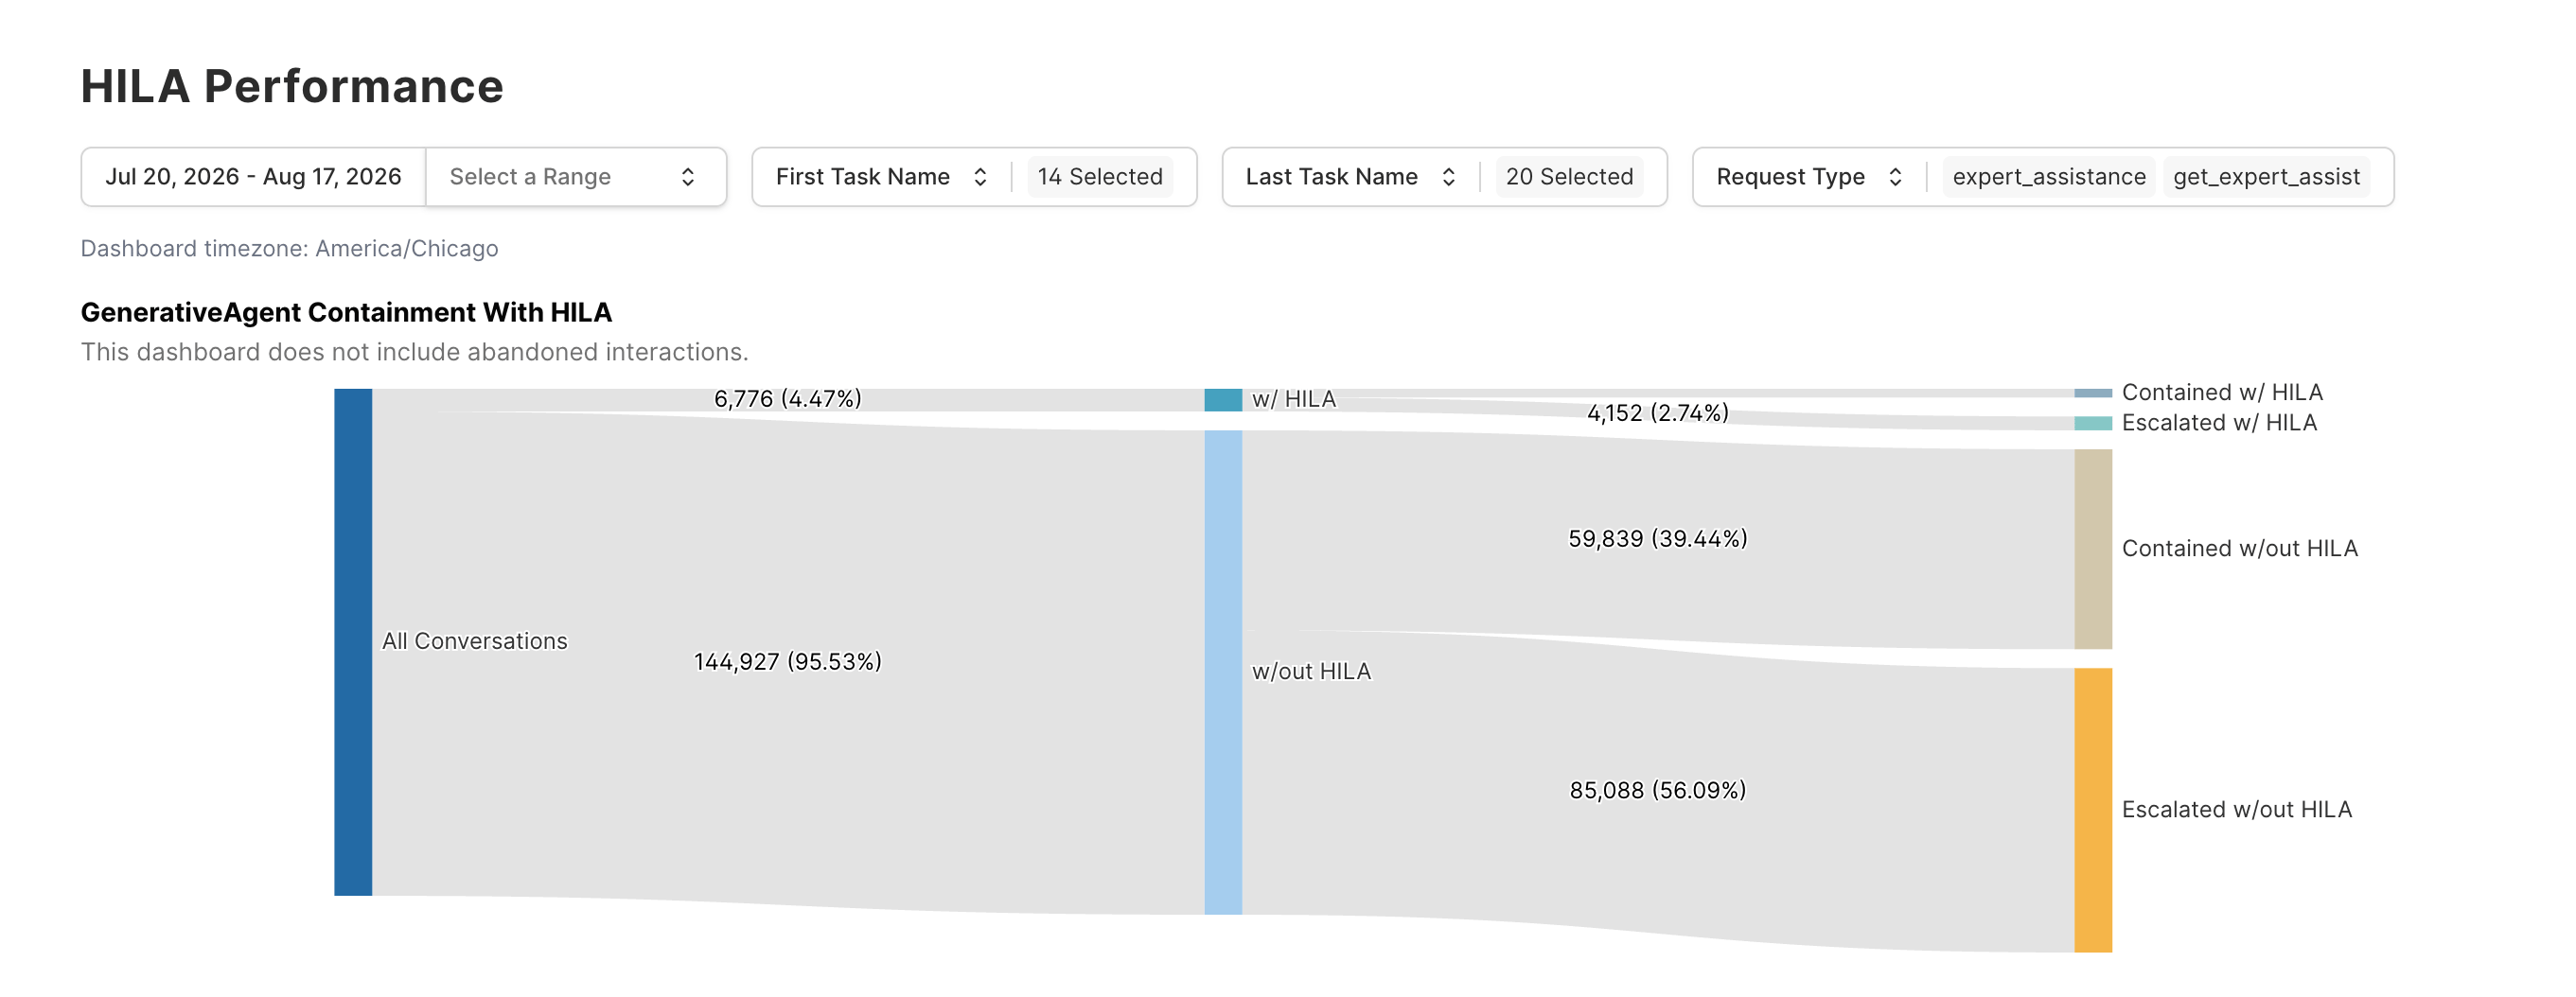
 This dashboard shows conversation data for interactions that involved a HILA consult. It is available to customers using [Human-in-the-Loop Assist](/generativeagent/human-in-the-loop).
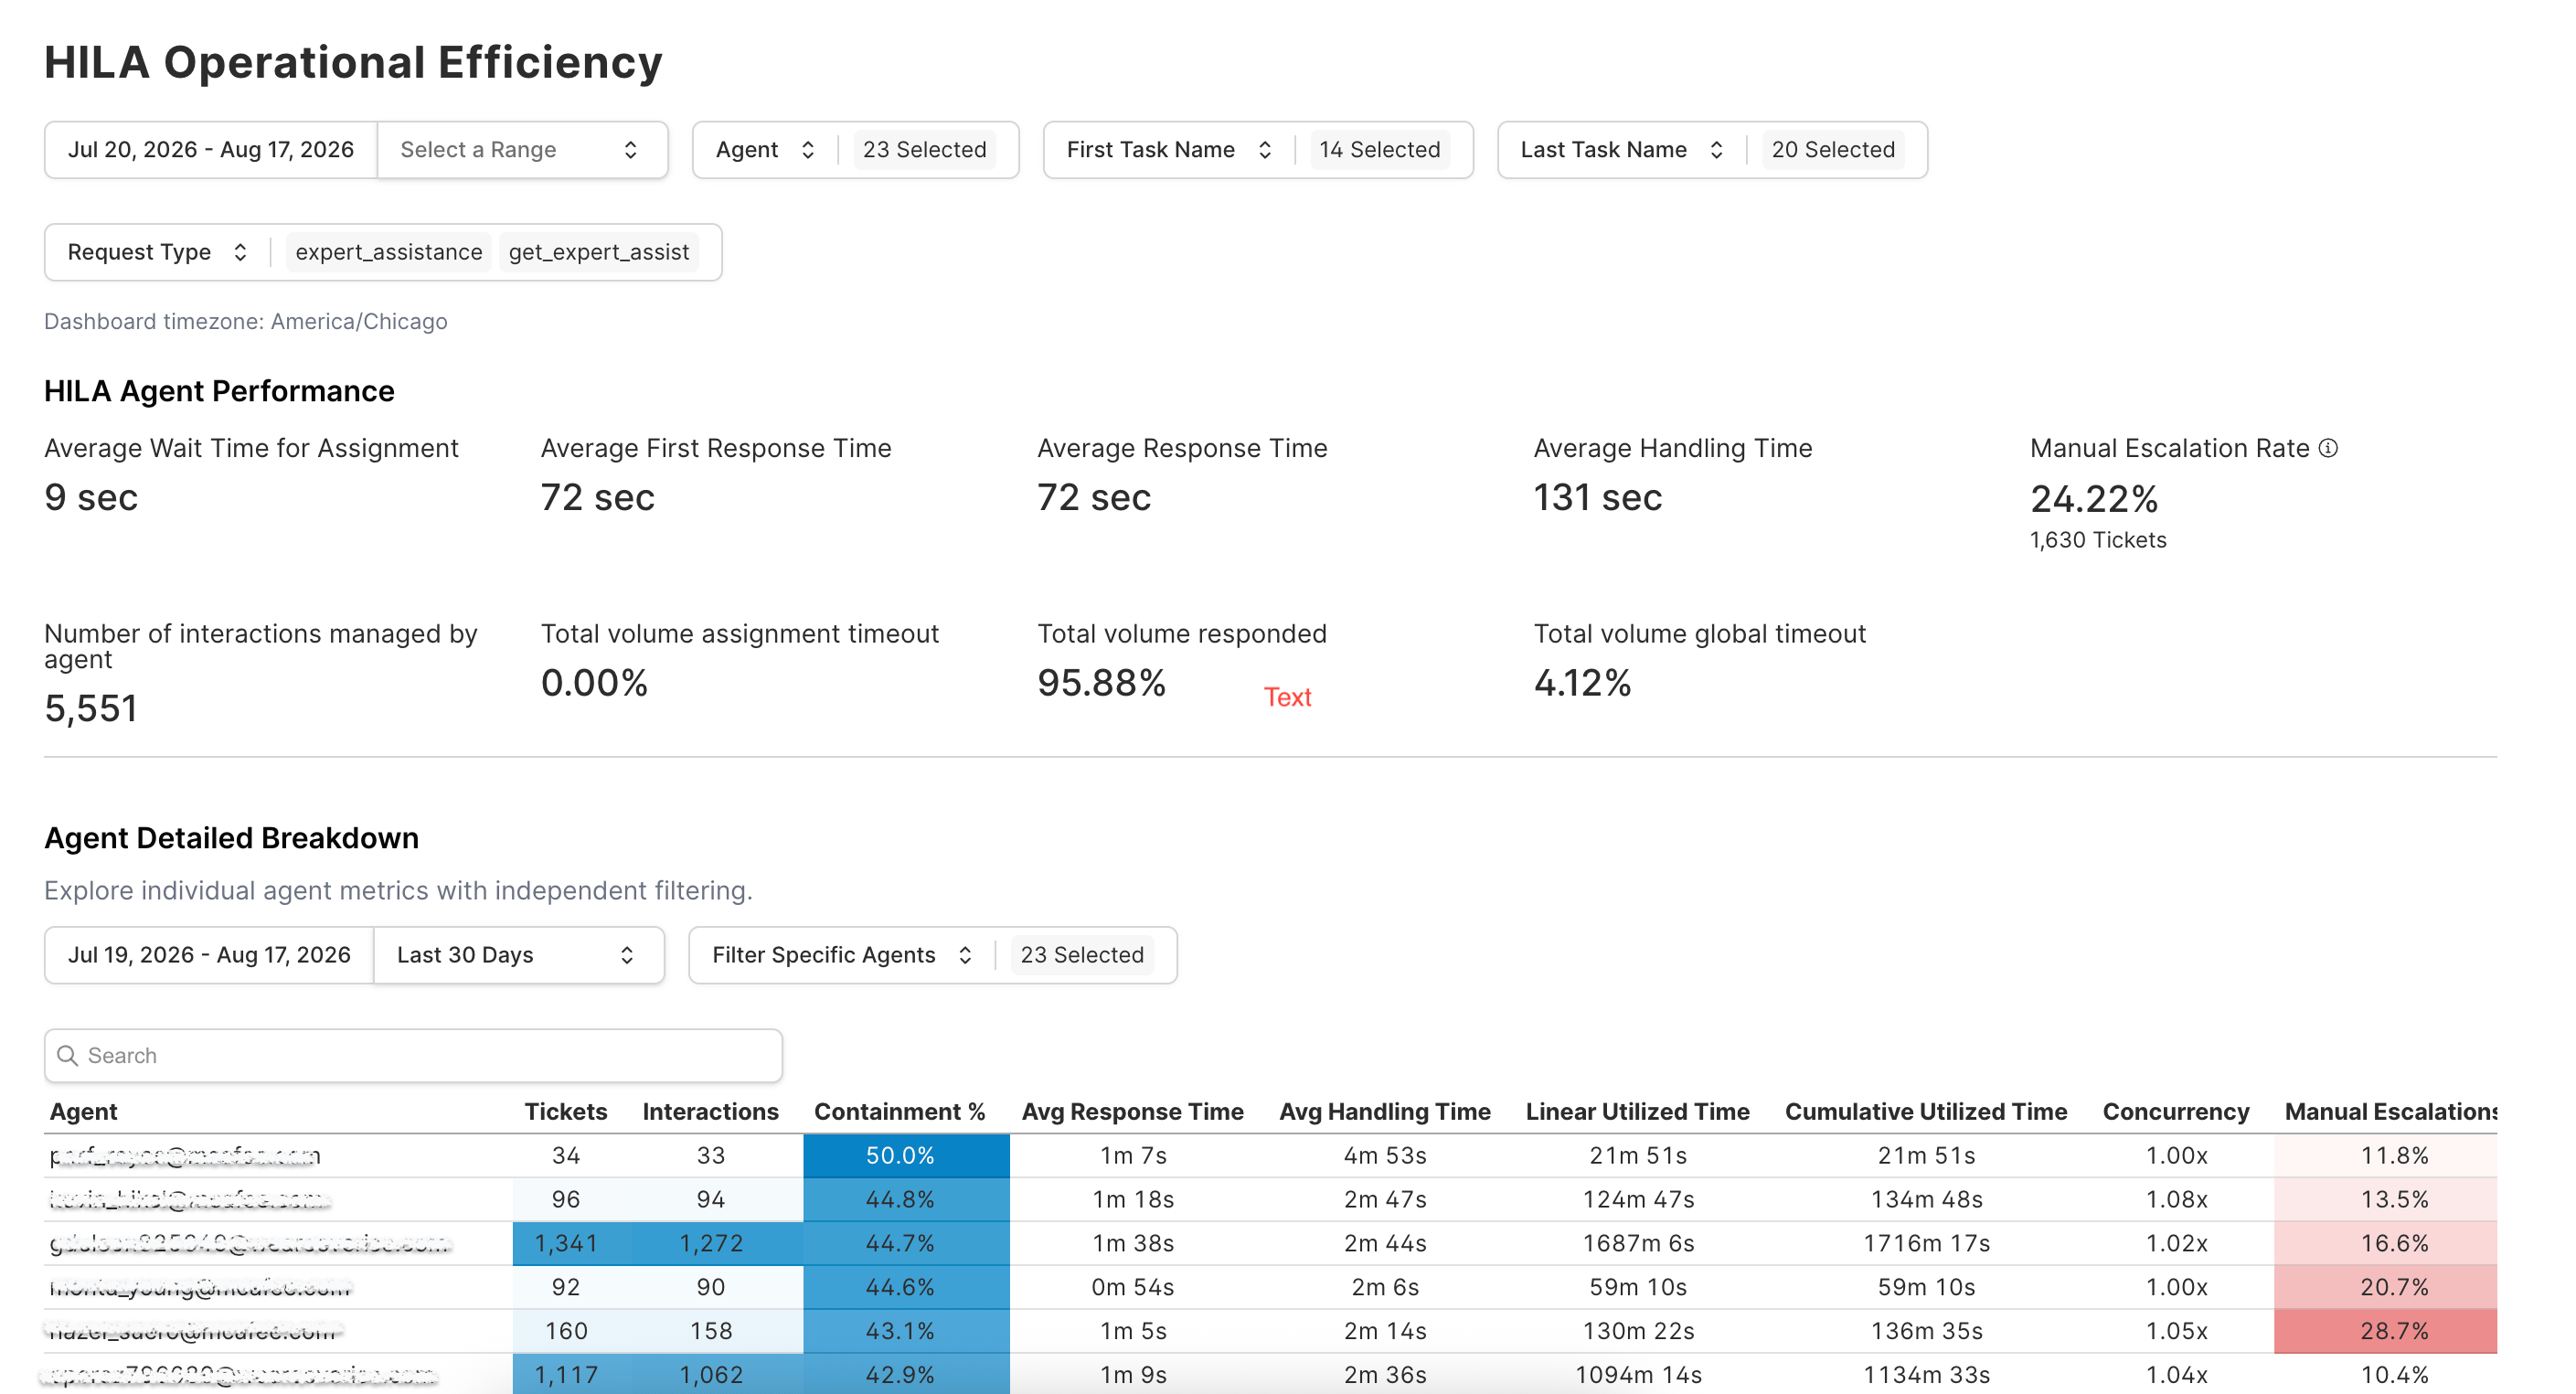
 This dashboard shows efficiency and throughput metrics for your HILA workflow. It is available to HILA customers.
 Dashboards are automatically enabled based on your configuration. If you expect to see a dashboard that isn't visible, contact your ASAPP CSM.
## Filter your data
At the top of each dashboard, you can filter the data shown using the following controls:
* **Date range**: Select a preset, such as Last 30 Days, or set a custom range.
* **Intent name**: Filter by one or more customer intents.
* **First Task**: Filter by the first task GenerativeAgent executed in a conversation.
* **Last Task**: Filter by the last task GenerativeAgent executed before the conversation ended.
Your selected filters persist as you navigate between dashboards within the same session.
## Dashboard settings
The following settings apply to all dashboards:
* **Timezone**: Dashboards display in America/New\_York by default. The current timezone is shown below the filters on each dashboard. Contact your ASAPP CSM if you need a different timezone configured.
* **Date of record**: If a conversation started on one day and ended on another, it is reflected on the day it started.
* **Sandbox conversations**: Sandbox conversations are not included in dashboards. Demo environments do have dashboard access.
## Data refresh schedules
Historical Insights data refreshes on two different schedules depending on the metric type:
* **Core Metrics** refresh every 3 hours and will typically be at most 6 hours stale
* **Intraday Metrics** refresh every 15 minutes and will typically be at most 90 minutes stale
If Core Metrics data appears to be more than 24 hours stale, or Intraday Metrics data appears to be more than 90 minutes stale, contact your ASAPP support team.
## Export the underlying data
If you need metrics beyond what the dashboards show, or want to combine GenerativeAgent data with your own analytics, export the raw data instead.
Pipe GenerativeAgent data into your own systems using File Exporter or S3 data feeds.
Dashboards are automatically enabled based on your configuration. If you expect to see a dashboard that isn't visible, contact your ASAPP CSM.
## Filter your data
At the top of each dashboard, you can filter the data shown using the following controls:
* **Date range**: Select a preset, such as Last 30 Days, or set a custom range.
* **Intent name**: Filter by one or more customer intents.
* **First Task**: Filter by the first task GenerativeAgent executed in a conversation.
* **Last Task**: Filter by the last task GenerativeAgent executed before the conversation ended.
Your selected filters persist as you navigate between dashboards within the same session.
## Dashboard settings
The following settings apply to all dashboards:
* **Timezone**: Dashboards display in America/New\_York by default. The current timezone is shown below the filters on each dashboard. Contact your ASAPP CSM if you need a different timezone configured.
* **Date of record**: If a conversation started on one day and ended on another, it is reflected on the day it started.
* **Sandbox conversations**: Sandbox conversations are not included in dashboards. Demo environments do have dashboard access.
## Data refresh schedules
Historical Insights data refreshes on two different schedules depending on the metric type:
* **Core Metrics** refresh every 3 hours and will typically be at most 6 hours stale
* **Intraday Metrics** refresh every 15 minutes and will typically be at most 90 minutes stale
If Core Metrics data appears to be more than 24 hours stale, or Intraday Metrics data appears to be more than 90 minutes stale, contact your ASAPP support team.
## Export the underlying data
If you need metrics beyond what the dashboards show, or want to combine GenerativeAgent data with your own analytics, export the raw data instead.
Pipe GenerativeAgent data into your own systems using File Exporter or S3 data feeds.