> ## Documentation Index
> Fetch the complete documentation index at: https://docs.asapp.com/llms.txt
> Use this file to discover all available pages before exploring further.
# Troubleshooting Guide
This document outlines some preliminary checks to determine the health and status of the connection between the customer or agent's browser and an ASAPP backend host prior to escalating to the ASAPP Support Team.
You must have access to Chrome Developer Tools in order to use this guide.
## Troubleshooting from a Web Browser
### Using Chrome Developer Tools
Please take a moment to familiarize yourself with Chrome Developer Tools, if you are not already. ASAPP will base the troubleshooting efforts for front-end Web SDK use around the Chrome Web Browser.
[https://developers.google.com/web/tools/chrome-devtools/open](https://developers.google.com/web/tools/chrome-devtools/open)
ASAPP will also inspect network traffic as the Web SDK makes API calls to the ASAPP backend. Please also review the documentation on Chrome Developer Tools regarding networking.
[https://developers.google.com/web/tools/chrome-devtools/network](https://developers.google.com/web/tools/chrome-devtools/network)
### API Call HTTP Return Status Codes
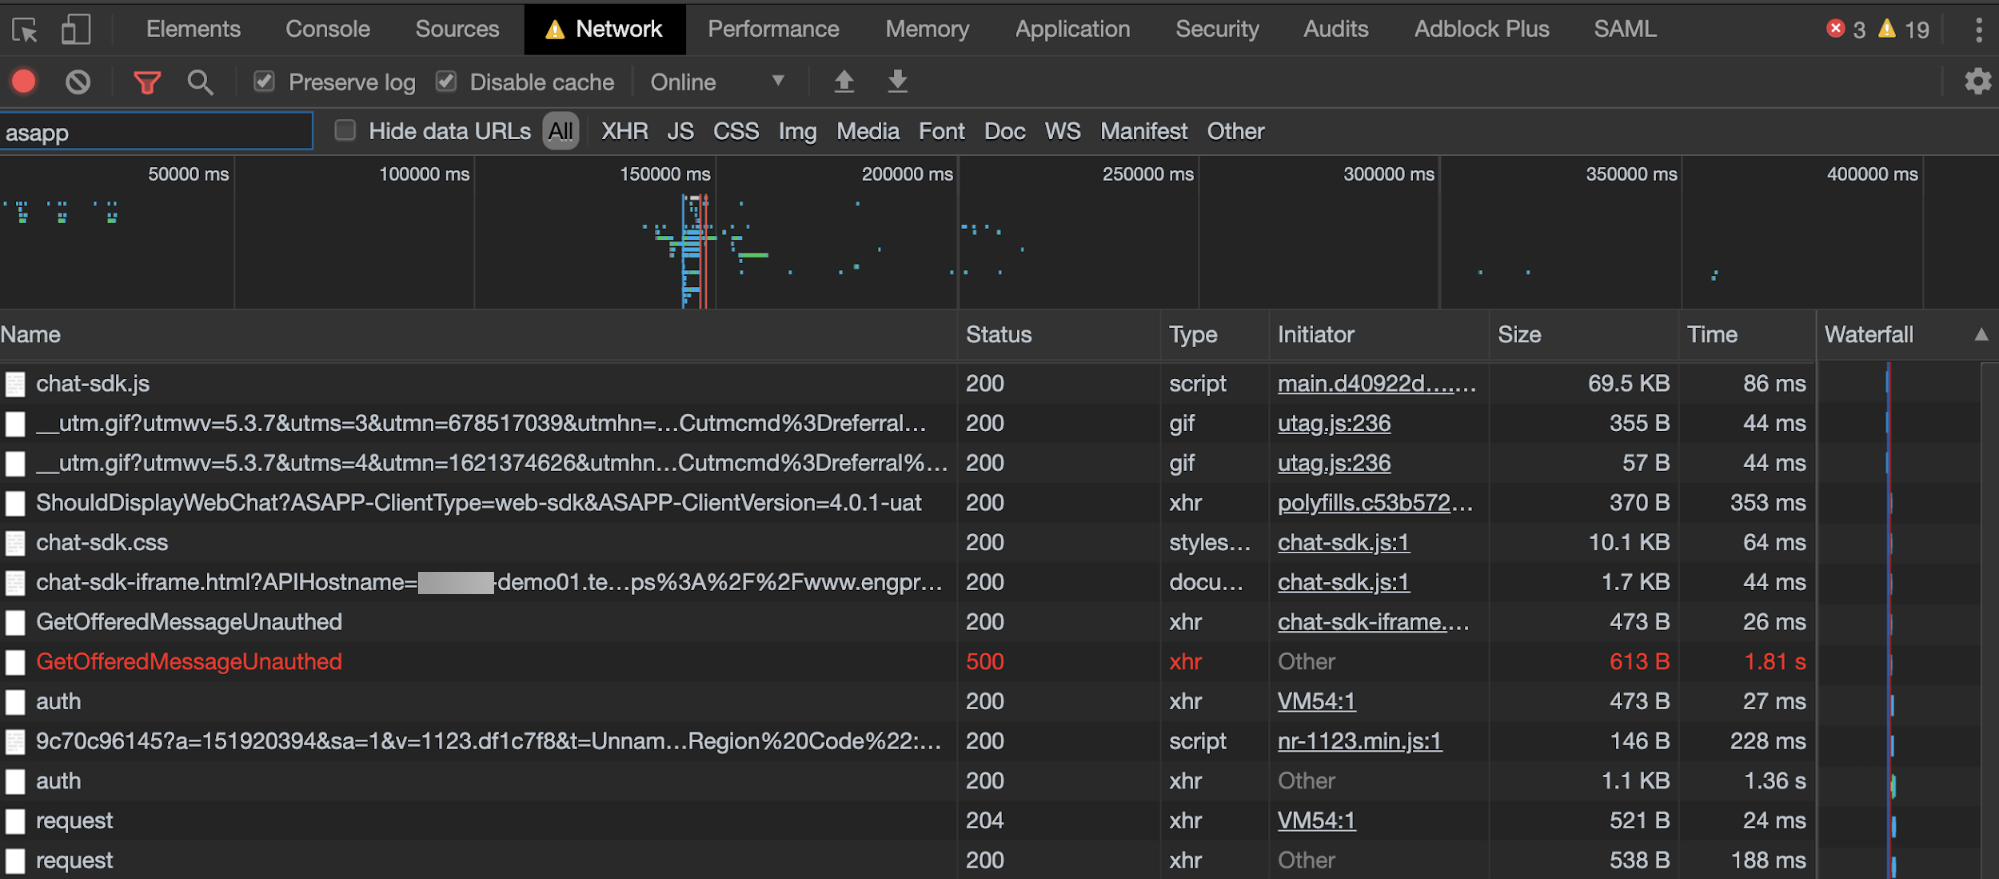
In general, you can check connectivity and environment status by looking at the HTTP return codes from the API calls the ASAPP Web SDK makes to the ASAPP backend. You can accomplish this by limiting calls to ASAPP traffic in the Network tab. This will narrow the results to traffic that is using the string "ASAPP" somewhere in the call.
First and foremost, look for traffic that does not return successful 200 HTTP status codes. If there are 400 and 500 level errors, there may be potential network connectivity or configuration issues between the user and ASAPP backend.
Please review HTTP status codes at: [https://www.restapitutorial.com/httpstatuscodes.html](https://www.restapitutorial.com/httpstatuscodes).
To view HTTP return codes:
1. Open **Dev Tools** and navigate to the **Network** tab.
2. Reload the page or navigate to a page with ASAPP chat enabled.
3. Filter network traffic to **ASAPP**.
4. Look at the "Status" for each call. The system highlights failed calls in red.
5. For non-200 status codes, denote what the call is by the "Request URL" and the return status. You can find other helpful information in context in the "Request Payload".
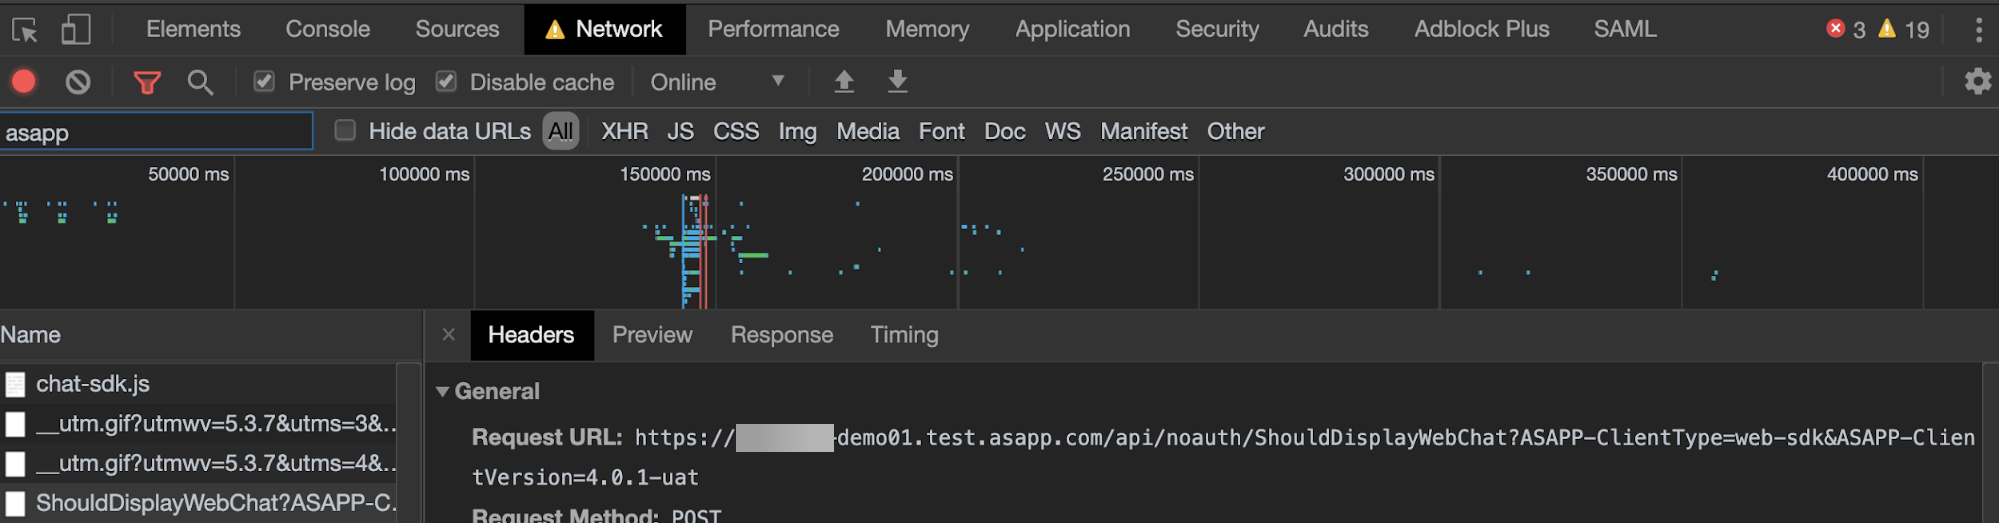
 ### Environment Targeting
To determine the ASAPP environment targeted by the front-end, you can look at the network traffic and note what hostname the traffic references. For instance, ...something-demo01.test.asapp.com is the demo environment for that implementation. You will see this on every call to the ASAPP backend and it may be helpful to filter the network traffic to "ASAPP".
1. Open **Dev Tools** and navigate to the **Network** tab.
2. Reload the page or navigate to a page with ASAPP chat enabled.
3. Filter network traffic to **ASAPP**.
4. Look at the "Request URL" for the network call.
5. Parse the hostname from `https://something-demo01.test.asapp.com/api/noauth/ShouldDisplayWebChat?ASAPP-ClientType=web-sdk&ASAPP-ClientVersion=4.0.1-uat\`: something-demo01.test.asapp.com
### Environment Targeting
To determine the ASAPP environment targeted by the front-end, you can look at the network traffic and note what hostname the traffic references. For instance, ...something-demo01.test.asapp.com is the demo environment for that implementation. You will see this on every call to the ASAPP backend and it may be helpful to filter the network traffic to "ASAPP".
1. Open **Dev Tools** and navigate to the **Network** tab.
2. Reload the page or navigate to a page with ASAPP chat enabled.
3. Filter network traffic to **ASAPP**.
4. Look at the "Request URL" for the network call.
5. Parse the hostname from `https://something-demo01.test.asapp.com/api/noauth/ShouldDisplayWebChat?ASAPP-ClientType=web-sdk&ASAPP-ClientVersion=4.0.1-uat\`: something-demo01.test.asapp.com
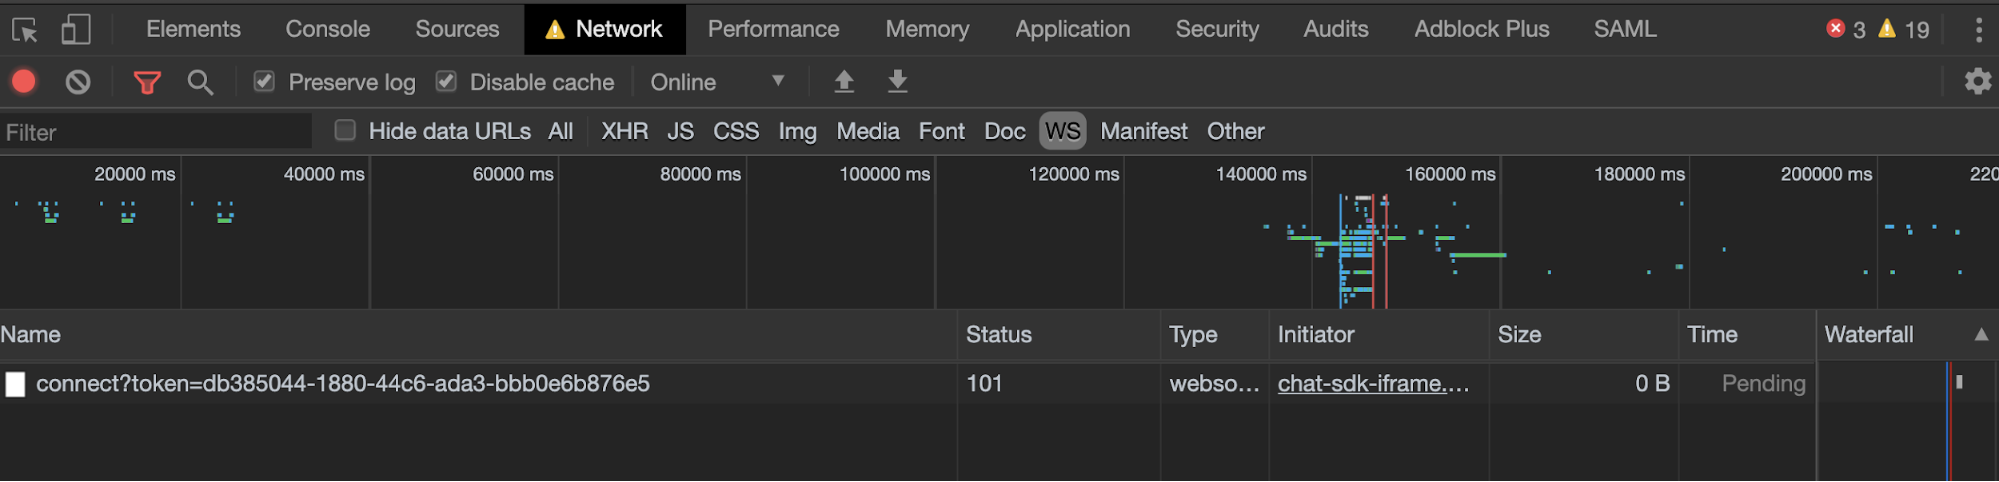
 ### WebSocket Status
In addition to looking at the API calls, it is important to look at the WebSocket connections in use. You should also be able to inspect the frames within the WebSocket to ensure the system receives messages properly.
### WebSocket Status
In addition to looking at the API calls, it is important to look at the WebSocket connections in use. You should also be able to inspect the frames within the WebSocket to ensure the system receives messages properly.
 [https://developers.google.com/web/tools/chrome-devtools/network/reference#frames](https://developers.google.com/web/tools/chrome-devtools/network/reference#frames)
## Troubleshooting Customer Chat
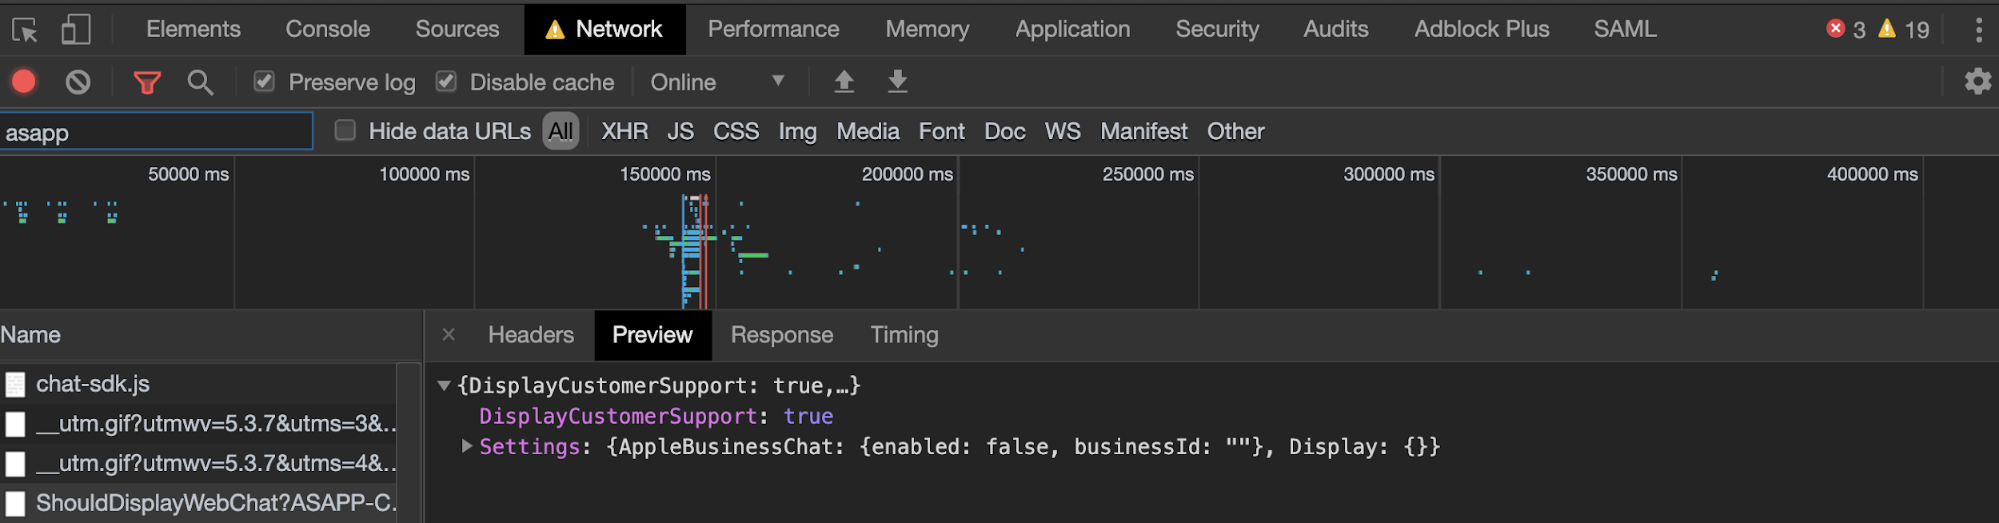
### Should Display Web Chat
If chat does not display on the desired web page, the first place to check is ASAPP's call for `ShouldDisplayWebChat` via the **Chrome Developer Tool Network** tab. A successful API call response should contain a `DisplayCustomerSupport` field with a value of `true`. If this value is `false` for a page that should display chat, please reach out to the ASAPP Support Team. Superusers can access the Triggers section of ASAPP Admin. This will enable them to determine if the visited URL displays chat.
To troubleshoot:
1. Open **Dev Tools** and navigate to the **Network** tab.
2. Reload the page or navigate to a page with ASAPP chat enabled.
3. Filter network traffic to **ASAPP**.
4. Look at the "Request Payload" for `ShouldDisplayWebChat` and look for a `true` response for `DisplayCustomerSupport`.
[https://developers.google.com/web/tools/chrome-devtools/network/reference#frames](https://developers.google.com/web/tools/chrome-devtools/network/reference#frames)
## Troubleshooting Customer Chat
### Should Display Web Chat
If chat does not display on the desired web page, the first place to check is ASAPP's call for `ShouldDisplayWebChat` via the **Chrome Developer Tool Network** tab. A successful API call response should contain a `DisplayCustomerSupport` field with a value of `true`. If this value is `false` for a page that should display chat, please reach out to the ASAPP Support Team. Superusers can access the Triggers section of ASAPP Admin. This will enable them to determine if the visited URL displays chat.
To troubleshoot:
1. Open **Dev Tools** and navigate to the **Network** tab.
2. Reload the page or navigate to a page with ASAPP chat enabled.
3. Filter network traffic to **ASAPP**.
4. Look at the "Request Payload" for `ShouldDisplayWebChat` and look for a `true` response for `DisplayCustomerSupport`.
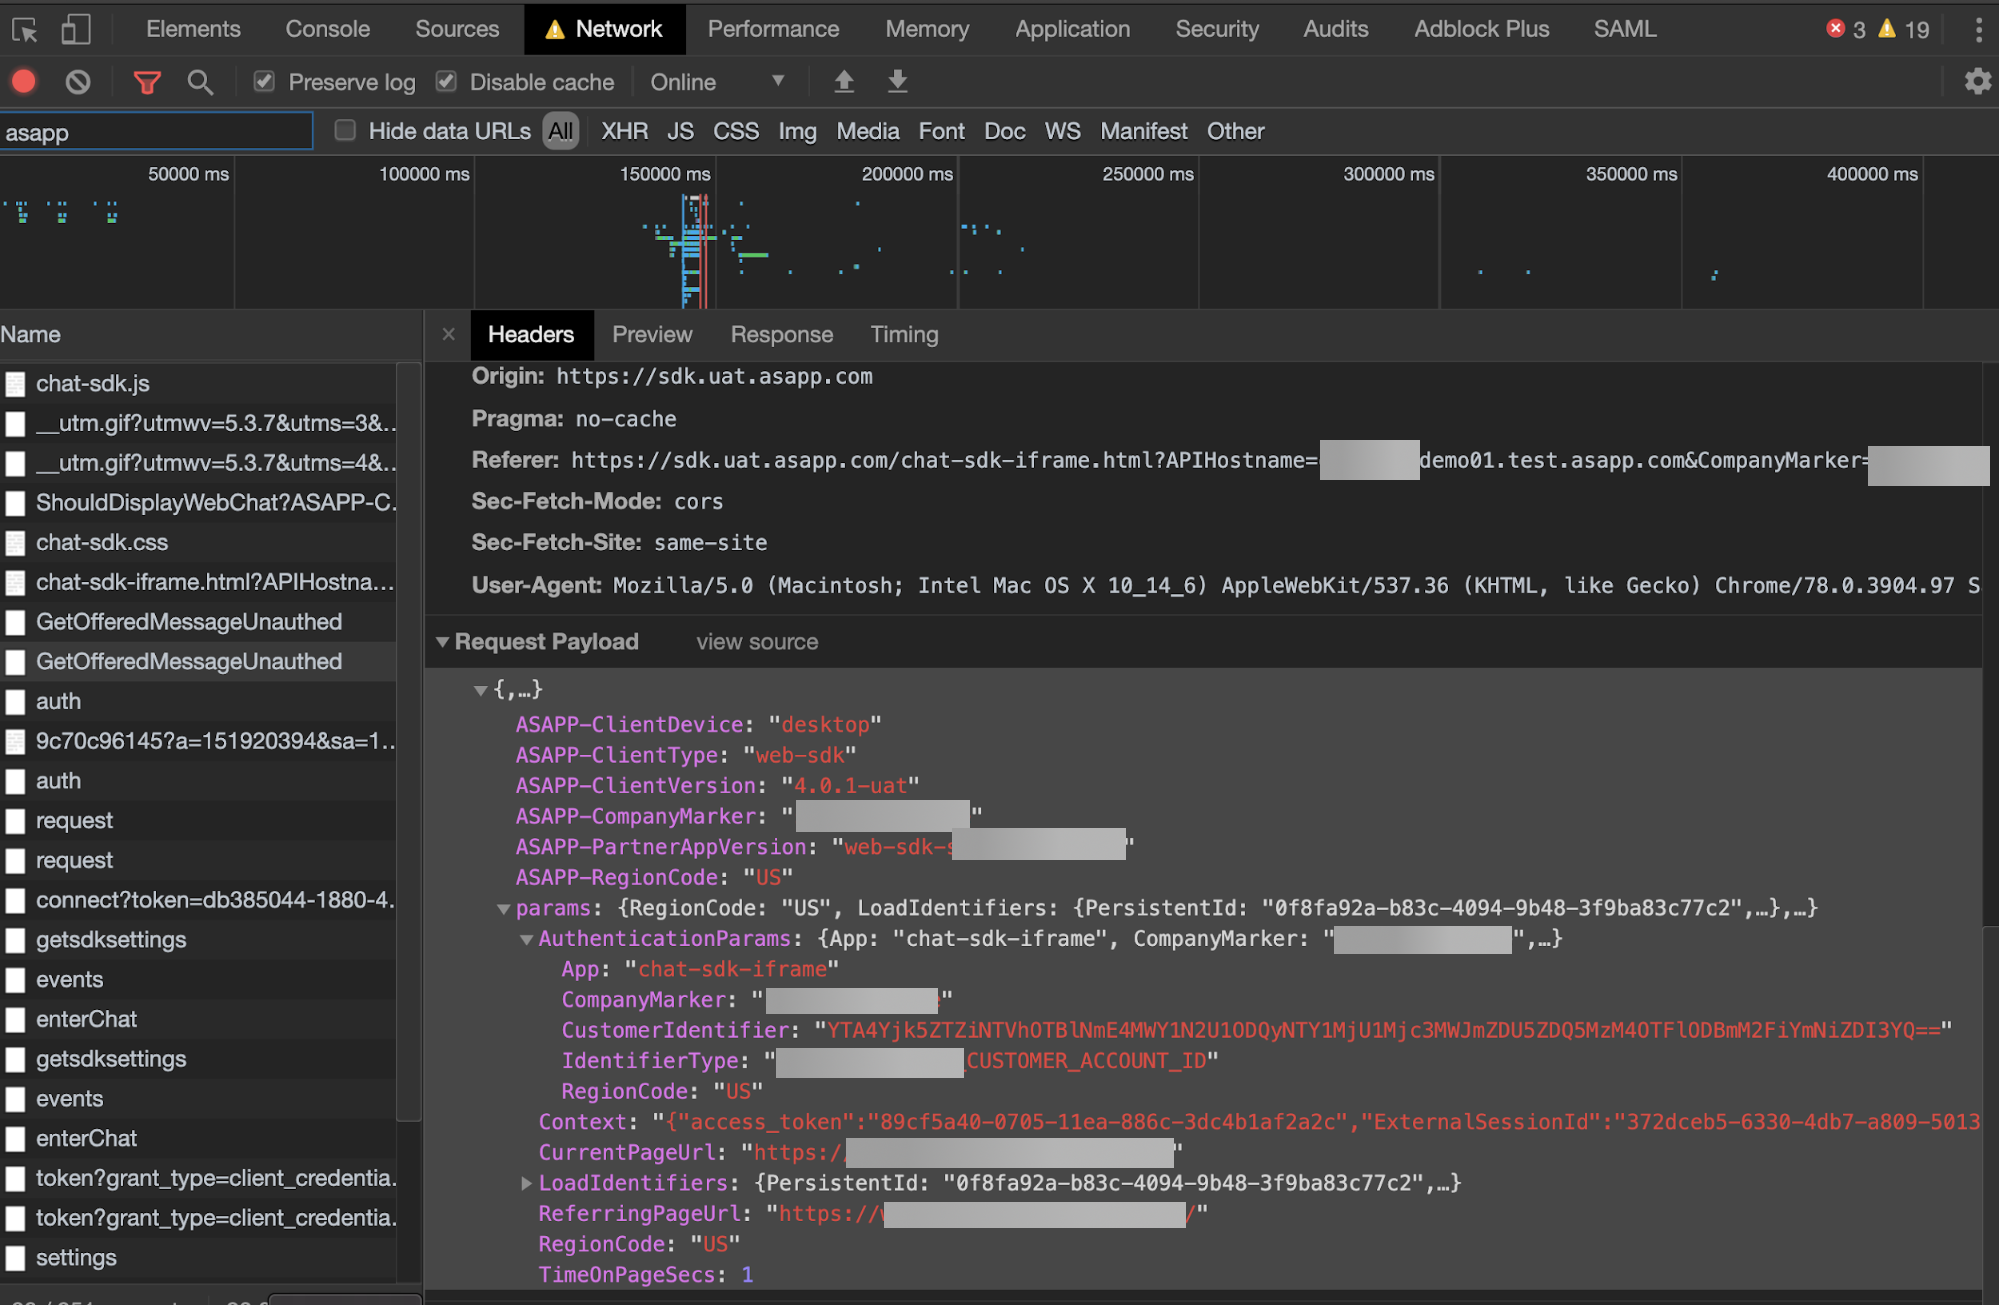
 ### Web SDK Context Input
To view the context provided to the SDK, you can look at the request payload of most SDK API calls. Context input may vary but typical items include:
* Subdivisions
* Segments
* Customer info parameters
* External session IDs
Review the ASAPP SDK Web Context Provider page
To view the context:
1. Open **Dev Tools** and navigate to the **Network** tab.
2. Reload page or navigate to a page with ASAPP chat enabled.
3. Filter network traffic to **ASAPP**.
4. Look at the "Request Payload" for `GetOfferedMessageUnauthed` and open the tree as follows:
**Params -> Params -> Context** -> All Customer Context (including Auth Token)
**Params -> Params -> AuthenticationParams** -> Customer ID
### Web SDK Context Input
To view the context provided to the SDK, you can look at the request payload of most SDK API calls. Context input may vary but typical items include:
* Subdivisions
* Segments
* Customer info parameters
* External session IDs
Review the ASAPP SDK Web Context Provider page
To view the context:
1. Open **Dev Tools** and navigate to the **Network** tab.
2. Reload page or navigate to a page with ASAPP chat enabled.
3. Filter network traffic to **ASAPP**.
4. Look at the "Request Payload" for `GetOfferedMessageUnauthed` and open the tree as follows:
**Params -> Params -> Context** -> All Customer Context (including Auth Token)
**Params -> Params -> AuthenticationParams** -> Customer ID
 ### Customer Authentication Input
For authenticated customer chat sessions, you can see the Auth key within the context parameters used throughout the API calls to ASAPP.
The values passed into the Auth context will depend on the integration.
Review the ASAPP SDK Web Context Provider page for the complete use of this key
## Troubleshooting Agent Chat from Agent Desk
### Connection Status Banners
There are 3 connection statuses:
* Disconnected (Red)
* Reconnecting (Yellow)
* Connected (Green)
You will see a banner on the bottom of the ASAPP Agent Desk with the correlating colors: Red, Yellow, Green. The red and green banners only appear briefly while the connection state changes. However, the yellow banner will remain until a connection is reestablished. The connection state relies on 2 main inputs:
* 204 API calls
* WebSocket echo timeouts
After a timeout grace period of 5 seconds for either of these timeouts, a red or yellow banner will appear.
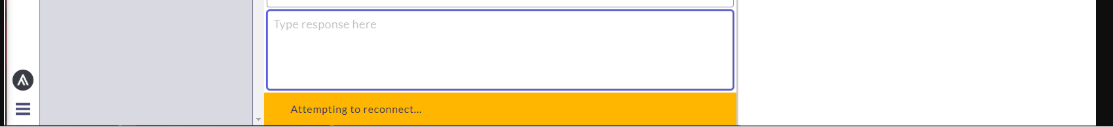
**Yellow Reconnecting Banner**
### Customer Authentication Input
For authenticated customer chat sessions, you can see the Auth key within the context parameters used throughout the API calls to ASAPP.
The values passed into the Auth context will depend on the integration.
Review the ASAPP SDK Web Context Provider page for the complete use of this key
## Troubleshooting Agent Chat from Agent Desk
### Connection Status Banners
There are 3 connection statuses:
* Disconnected (Red)
* Reconnecting (Yellow)
* Connected (Green)
You will see a banner on the bottom of the ASAPP Agent Desk with the correlating colors: Red, Yellow, Green. The red and green banners only appear briefly while the connection state changes. However, the yellow banner will remain until a connection is reestablished. The connection state relies on 2 main inputs:
* 204 API calls
* WebSocket echo timeouts
After a timeout grace period of 5 seconds for either of these timeouts, a red or yellow banner will appear.
**Yellow Reconnecting Banner**
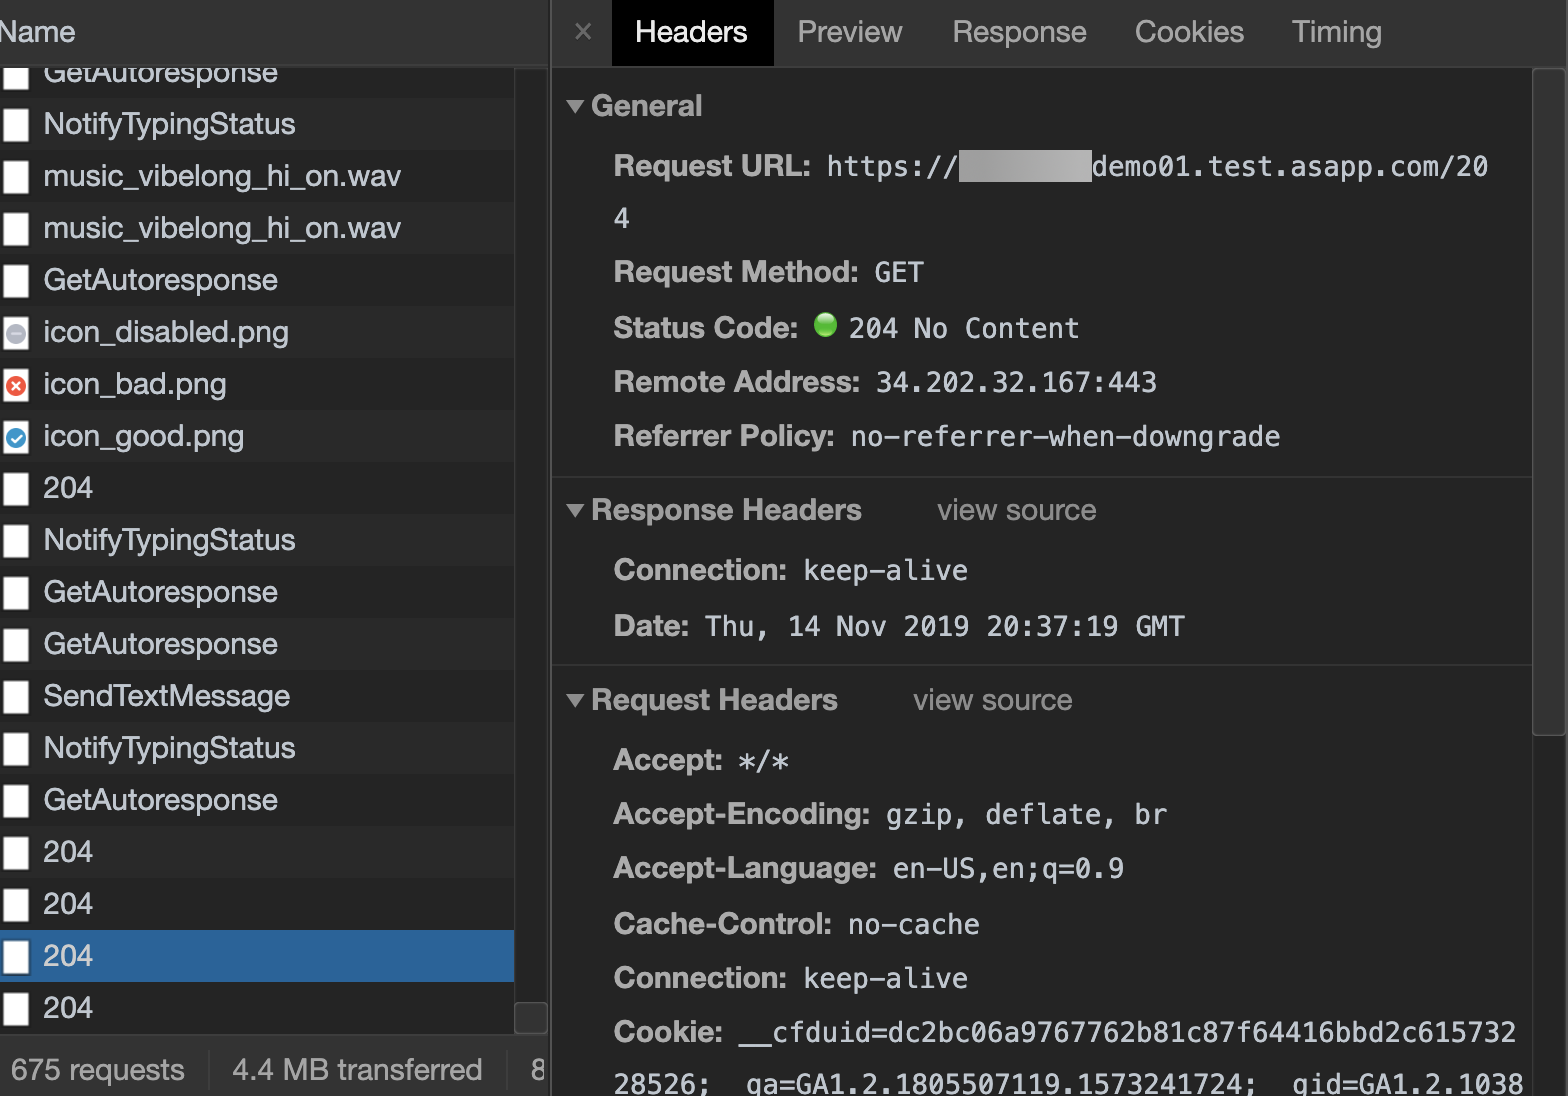
 ### 204 API call
The ASAPP Agent Desk makes API calls to the backend periodically to ensure status and connectivity reporting is functional. Verify the HTTP status and response timing of these calls to look for indicators of an issue. These calls display as the number 204 in the Chrome Developer Tools Network tab.
To view these calls:
1. Open **Dev Tools** and navigate to the **Network** tab.
2. Reload page or navigate to a page with ASAPP chat enabled.
3. Filter network traffic to **ASAPP**.
4. Look at the "204" calls over time to determine good health.
### 204 API call
The ASAPP Agent Desk makes API calls to the backend periodically to ensure status and connectivity reporting is functional. Verify the HTTP status and response timing of these calls to look for indicators of an issue. These calls display as the number 204 in the Chrome Developer Tools Network tab.
To view these calls:
1. Open **Dev Tools** and navigate to the **Network** tab.
2. Reload page or navigate to a page with ASAPP chat enabled.
3. Filter network traffic to **ASAPP**.
4. Look at the "204" calls over time to determine good health.
 ### WebSocket
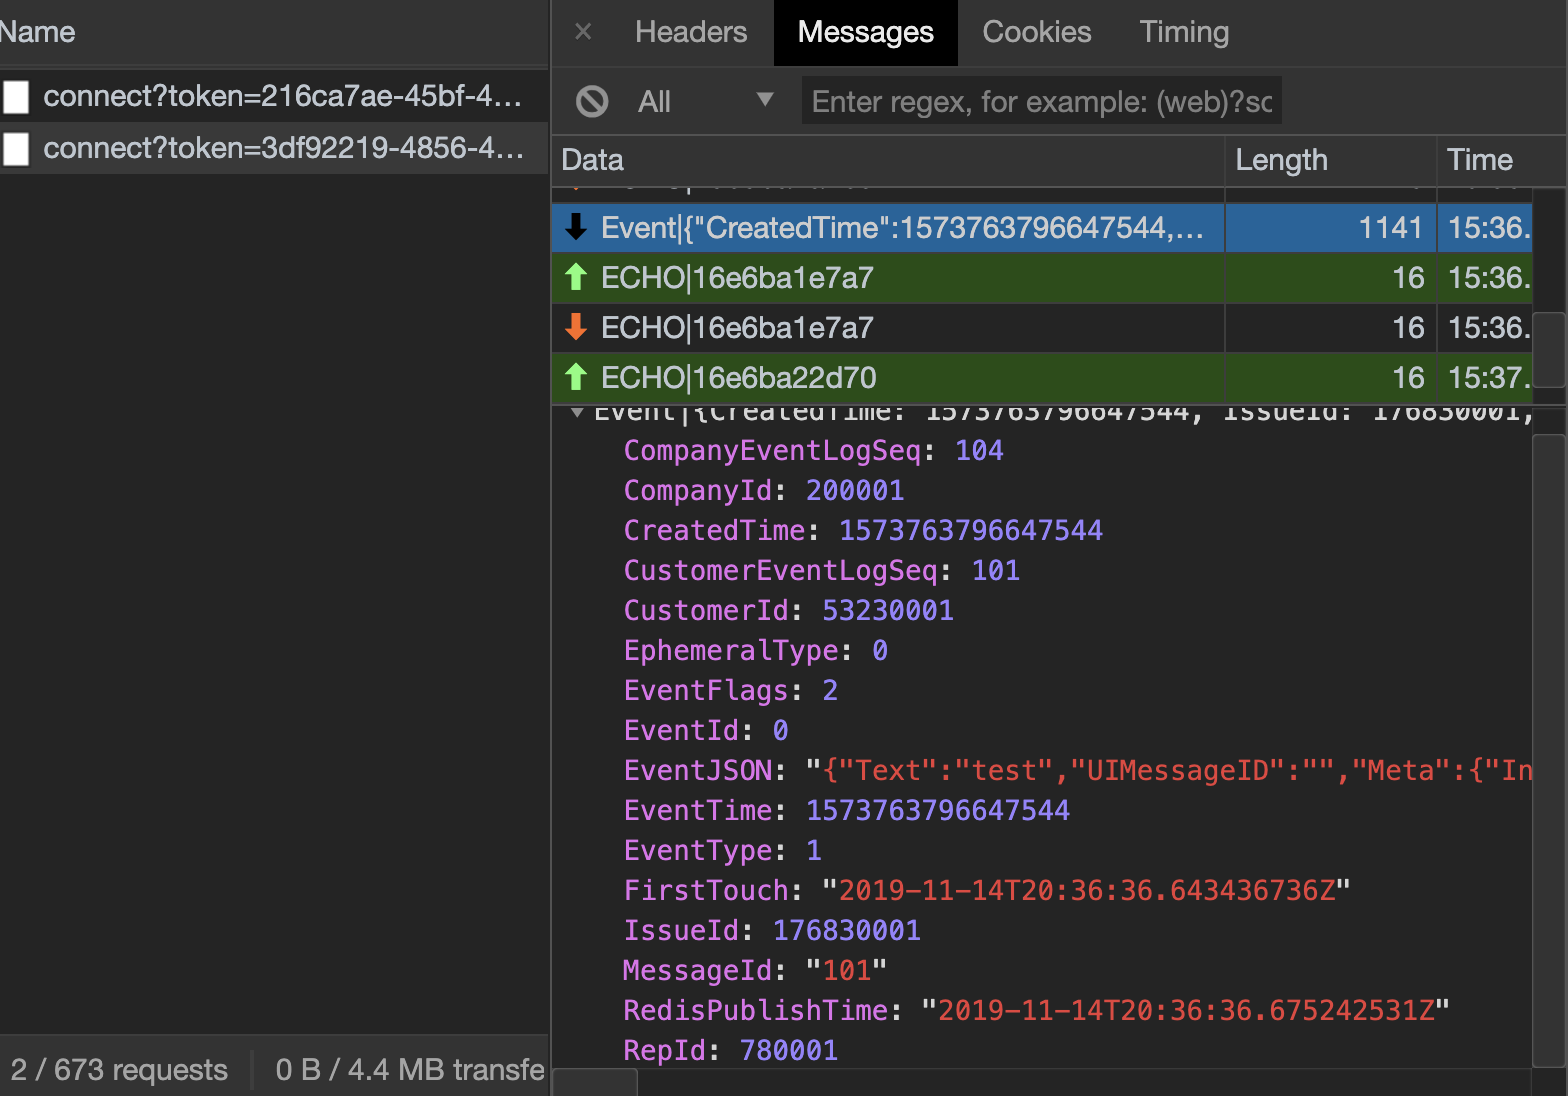
When a customer chat loads onto the ASAPP Agent Desk, this creates a WebSocket. During the life of that conversation, ASAPP sends continual echoes (requests and responses) to determine WebSocket health and status. ASAPP sends the echoes every 16-18 seconds and has a 6 second timeout by default. If these requests and responses intermittently time out, there is likely a network issue between the Agent Desktop and the ASAPP Desk application.
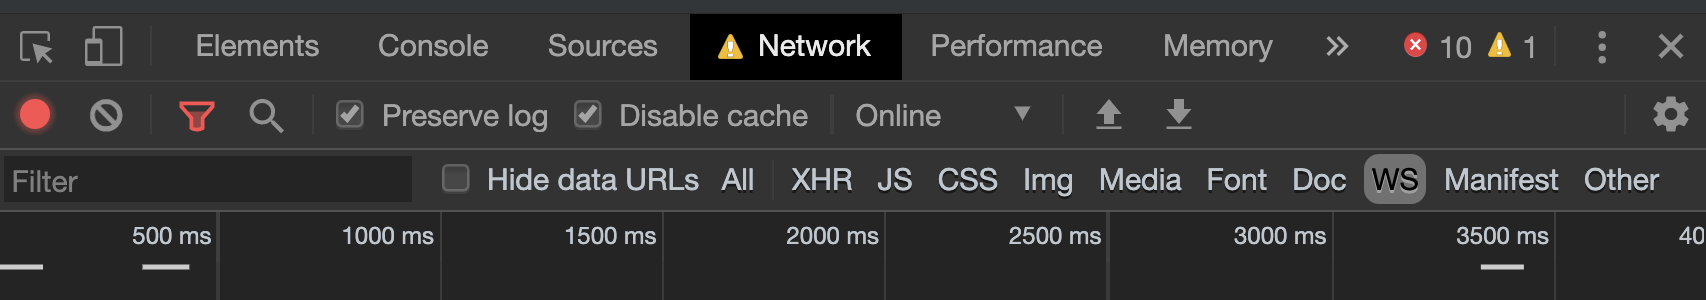
You can also view messages being sent through WebSocket, as the agent to customer conversation happens:
1. Open **Dev Tools** and navigate to the **Network** tab.
2. Reload page or navigate to a page with ASAPP chat enabled.
3. Click **WS** next to the Filter text box to filter network traffic to WebSocket.
4. Look at the Messages tab in WebSocket.
### WebSocket
When a customer chat loads onto the ASAPP Agent Desk, this creates a WebSocket. During the life of that conversation, ASAPP sends continual echoes (requests and responses) to determine WebSocket health and status. ASAPP sends the echoes every 16-18 seconds and has a 6 second timeout by default. If these requests and responses intermittently time out, there is likely a network issue between the Agent Desktop and the ASAPP Desk application.
You can also view messages being sent through WebSocket, as the agent to customer conversation happens:
1. Open **Dev Tools** and navigate to the **Network** tab.
2. Reload page or navigate to a page with ASAPP chat enabled.
3. Click **WS** next to the Filter text box to filter network traffic to WebSocket.
4. Look at the Messages tab in WebSocket.
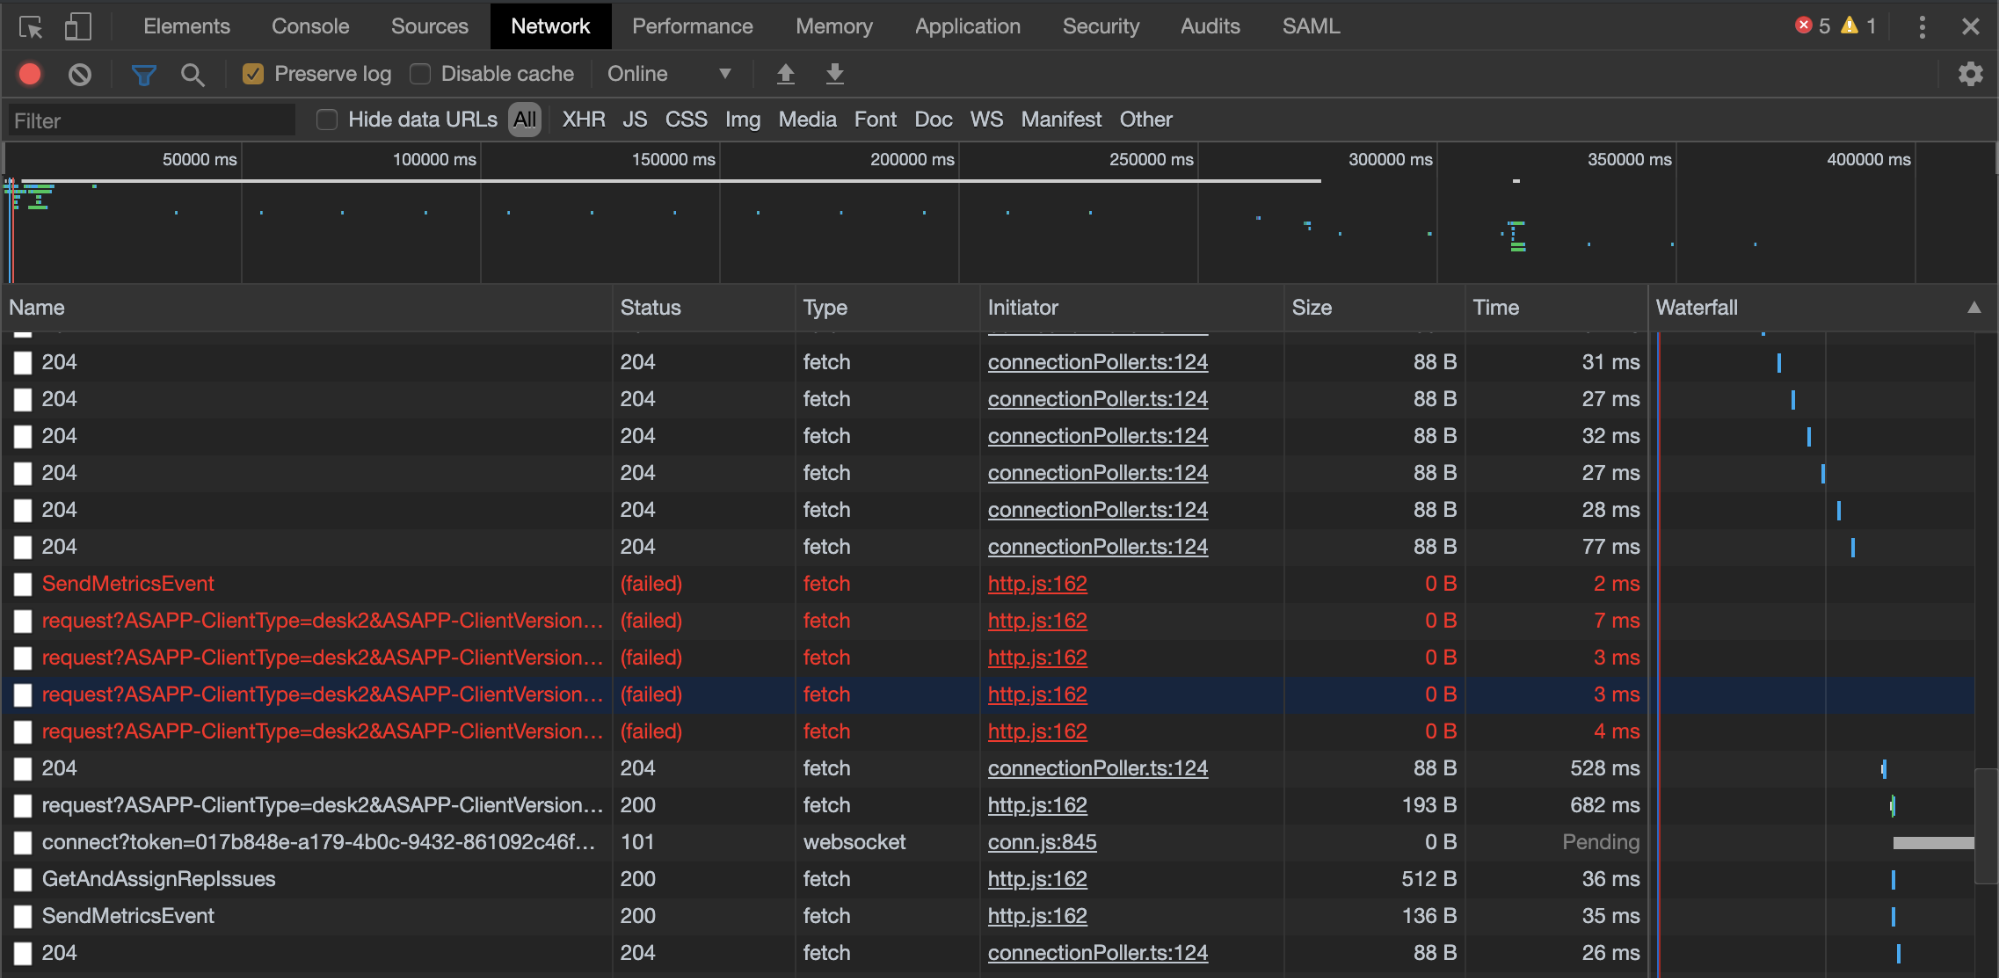
 If you see one of these pairs of echoes missing, it is most likely because Agent Desk did not receive the echo from the ASAPP backend due to packet loss. If the 'Attempting to reconnect..' message shows, Agent Desk attempts to reconnect with the ASAPP backend to establish a new WebSocket. The messages display in red text starting with 'request?ASAPP-ClientType' in the Network tab of Chrome Developer Tools.
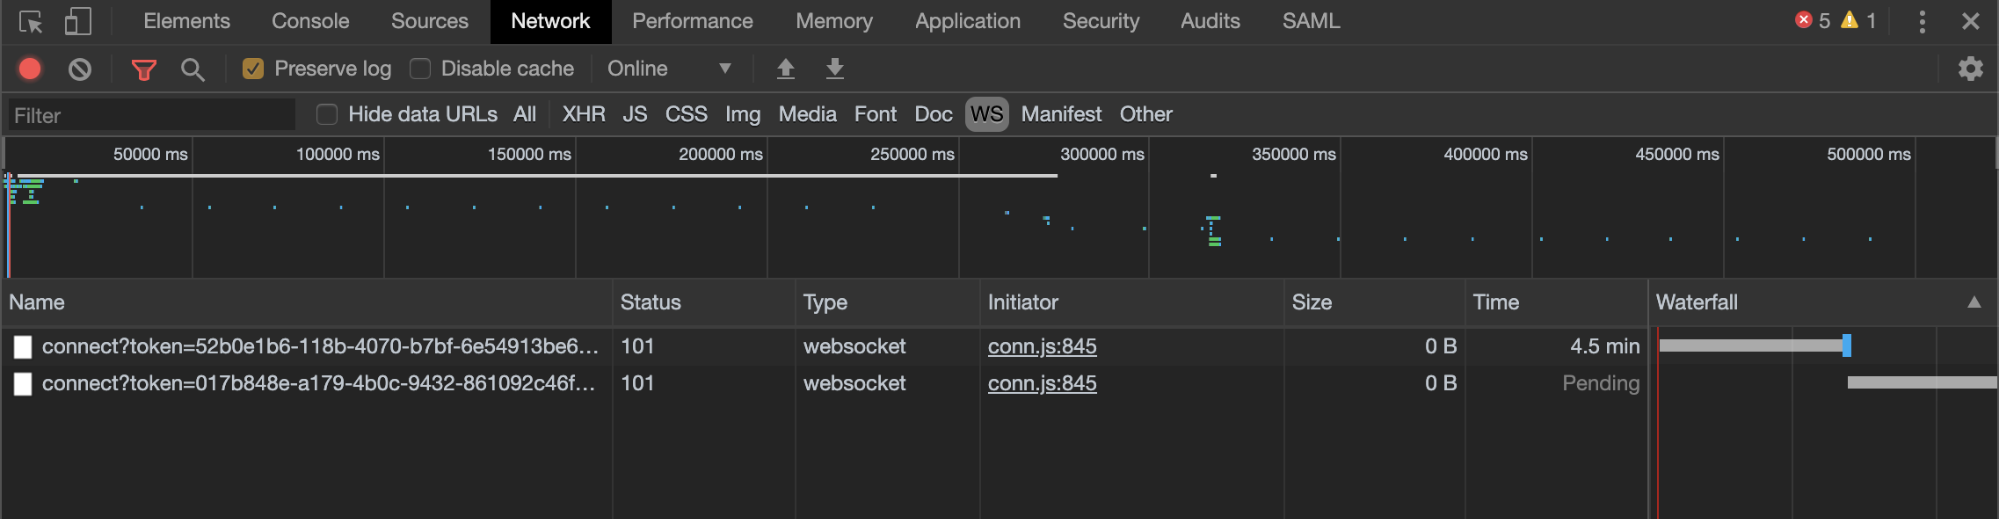
 If you lose network connectivity and then re-establish it, there will be multiple WebSocket entries visible when you click on **WS**.
 ## Troubleshooting Agent Desk/Admin Access Issues
### Using Employee List in ASAPP Admin
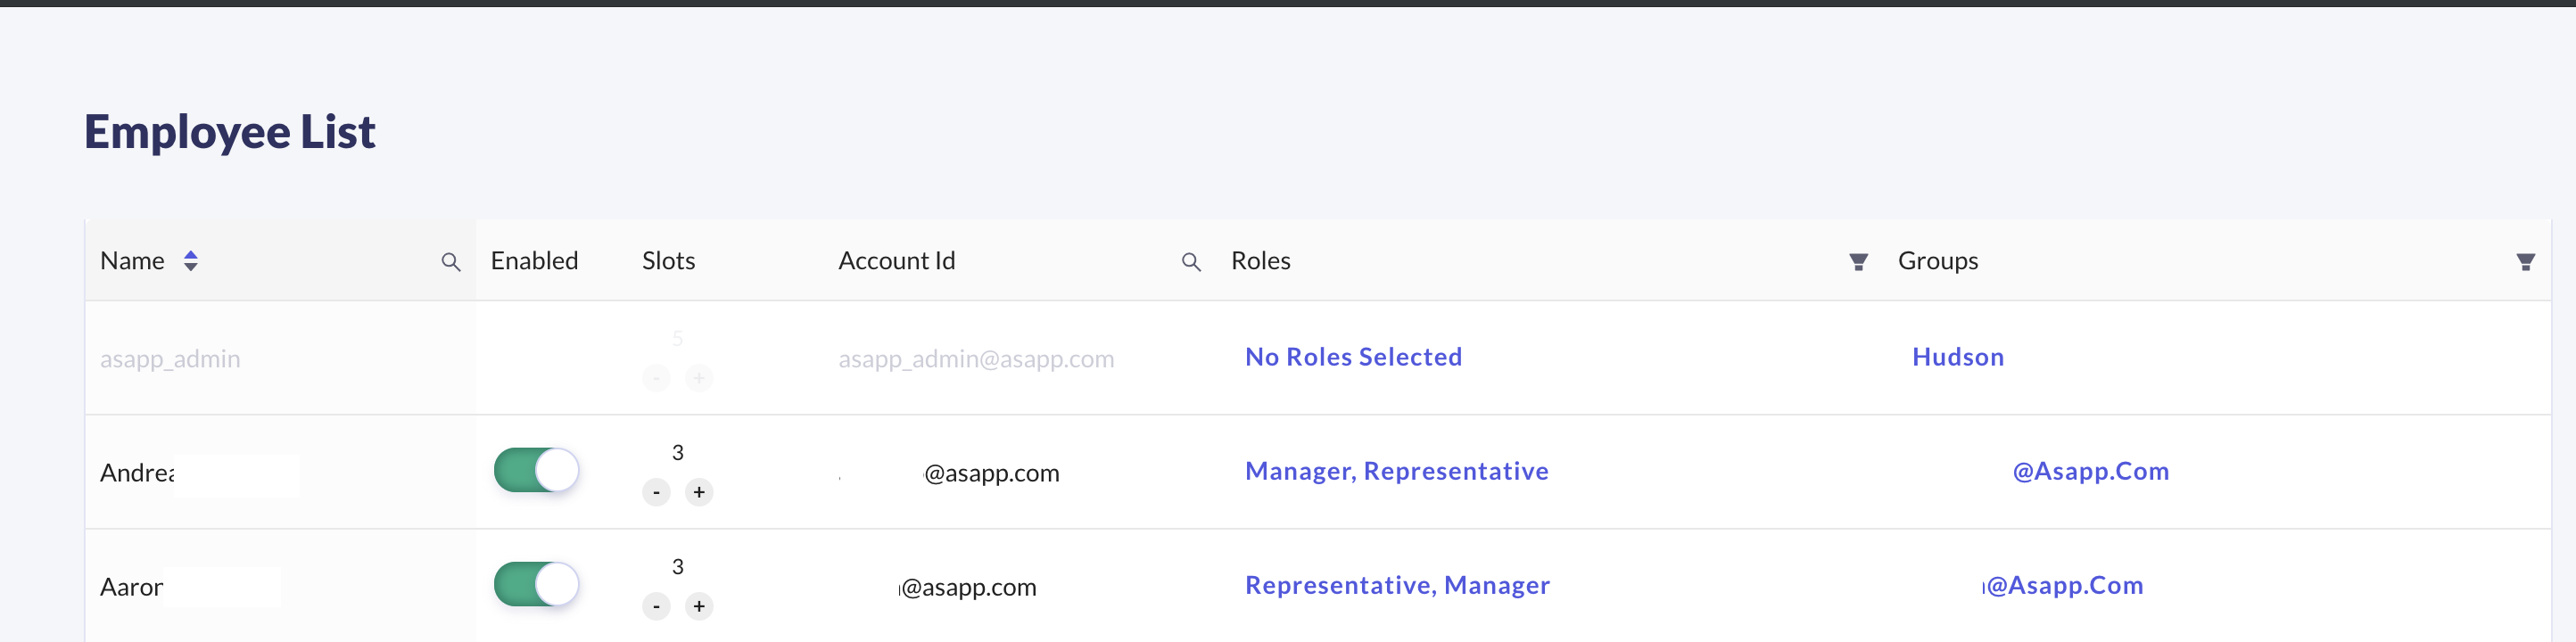
If a user has issues logging in to ASAPP, you can view their details within ASAPP Admin after their first successful login. Check the Enabled status, Roles, and Groups for the user to determine if there are any user level issues. ASAPP will reject the user's login attempt if their account is disabled.
To find an employee:
1. Login to ASAPP Admin.
2. Navigate to Employee List.
3. Use the filter to find the desired account.
4. Check account attributes for: Enabled, Roles, and Groups.
## Troubleshooting Agent Desk/Admin Access Issues
### Using Employee List in ASAPP Admin
If a user has issues logging in to ASAPP, you can view their details within ASAPP Admin after their first successful login. Check the Enabled status, Roles, and Groups for the user to determine if there are any user level issues. ASAPP will reject the user's login attempt if their account is disabled.
To find an employee:
1. Login to ASAPP Admin.
2. Navigate to Employee List.
3. Use the filter to find the desired account.
4. Check account attributes for: Enabled, Roles, and Groups.
 ### Employee Roles Mismatch
During the user's SSO login process, ASAPP receives a list of user roles via the Single-Sign-On SAML assertion.
If the user roles in the Employee List is incorrect:
1. Check with your Identity & Access Management team to verify that the user has been added to the correct set of AD Security Groups.
2. Once you have verified the user's AD Security Groups, please ask the user to log out and log back in using the IDP-initiated SSO URL.
3. If you still see a mismatch between the user's AD Security Groups and the ASAPP Employee List, then please reach out to the ASAPP Support Team.
### Errors During User Login
The SSO flow is a series of browser redirects in the following order:
1. Your SSO engine IDP-initiated URL -- typically hosted within your domain. This is the URL that users must use to login.
2. Your system's authentication system -- typically hosted within your domain. If the user is already authenticated, then it will immediately redirect the user back to your SSO engine URL. Otherwise, the user will be presented with the login page and prompted to enter their credentials.
3. ASAPP's SSO engine -- hosted on the auth-\{customerName}.asapp.com domain.
4. ASAPP's Agent/Admin app -- hosted on the \{customerName}.asapp.com domain.
There are several potential errors that may happen during login. In all of these cases, it is beneficial to find out:
1. The SSO login URL being used by the user to login.
2. The error page URL and error message displayed.
#### Incorrect SSO Login URL
Confirm the user logins to the correct SSO URL. Due to browser redirects, users may accidentally bookmark an incorrect URL (e.g., ASAPP's SSO engine URL, instead of your SSO engine IDP-initiated URL).
#### Invalid Role Values in the SSO SAML Assertion
If the user sees a "Failed to authenticate user" error message and the URL is an ASAPP URL (...asapp.com), then please confirm that correct role values are being sent in the SAML assertion. This error message typically indicates that the user role value is not recognizable within ASAPP.
#### Other Login Errors
For any other errors, please check the error page URL. If the error page URL is an ASAPP URL (ends in asapp.com), please reach out to the ASAPP Support Team for help. If the URL is your SSO URL or your system's authentication system, please contact your internal support team.
### Employee Roles Mismatch
During the user's SSO login process, ASAPP receives a list of user roles via the Single-Sign-On SAML assertion.
If the user roles in the Employee List is incorrect:
1. Check with your Identity & Access Management team to verify that the user has been added to the correct set of AD Security Groups.
2. Once you have verified the user's AD Security Groups, please ask the user to log out and log back in using the IDP-initiated SSO URL.
3. If you still see a mismatch between the user's AD Security Groups and the ASAPP Employee List, then please reach out to the ASAPP Support Team.
### Errors During User Login
The SSO flow is a series of browser redirects in the following order:
1. Your SSO engine IDP-initiated URL -- typically hosted within your domain. This is the URL that users must use to login.
2. Your system's authentication system -- typically hosted within your domain. If the user is already authenticated, then it will immediately redirect the user back to your SSO engine URL. Otherwise, the user will be presented with the login page and prompted to enter their credentials.
3. ASAPP's SSO engine -- hosted on the auth-\{customerName}.asapp.com domain.
4. ASAPP's Agent/Admin app -- hosted on the \{customerName}.asapp.com domain.
There are several potential errors that may happen during login. In all of these cases, it is beneficial to find out:
1. The SSO login URL being used by the user to login.
2. The error page URL and error message displayed.
#### Incorrect SSO Login URL
Confirm the user logins to the correct SSO URL. Due to browser redirects, users may accidentally bookmark an incorrect URL (e.g., ASAPP's SSO engine URL, instead of your SSO engine IDP-initiated URL).
#### Invalid Role Values in the SSO SAML Assertion
If the user sees a "Failed to authenticate user" error message and the URL is an ASAPP URL (...asapp.com), then please confirm that correct role values are being sent in the SAML assertion. This error message typically indicates that the user role value is not recognizable within ASAPP.
#### Other Login Errors
For any other errors, please check the error page URL. If the error page URL is an ASAPP URL (ends in asapp.com), please reach out to the ASAPP Support Team for help. If the URL is your SSO URL or your system's authentication system, please contact your internal support team.