Out-of-the-box dashboards
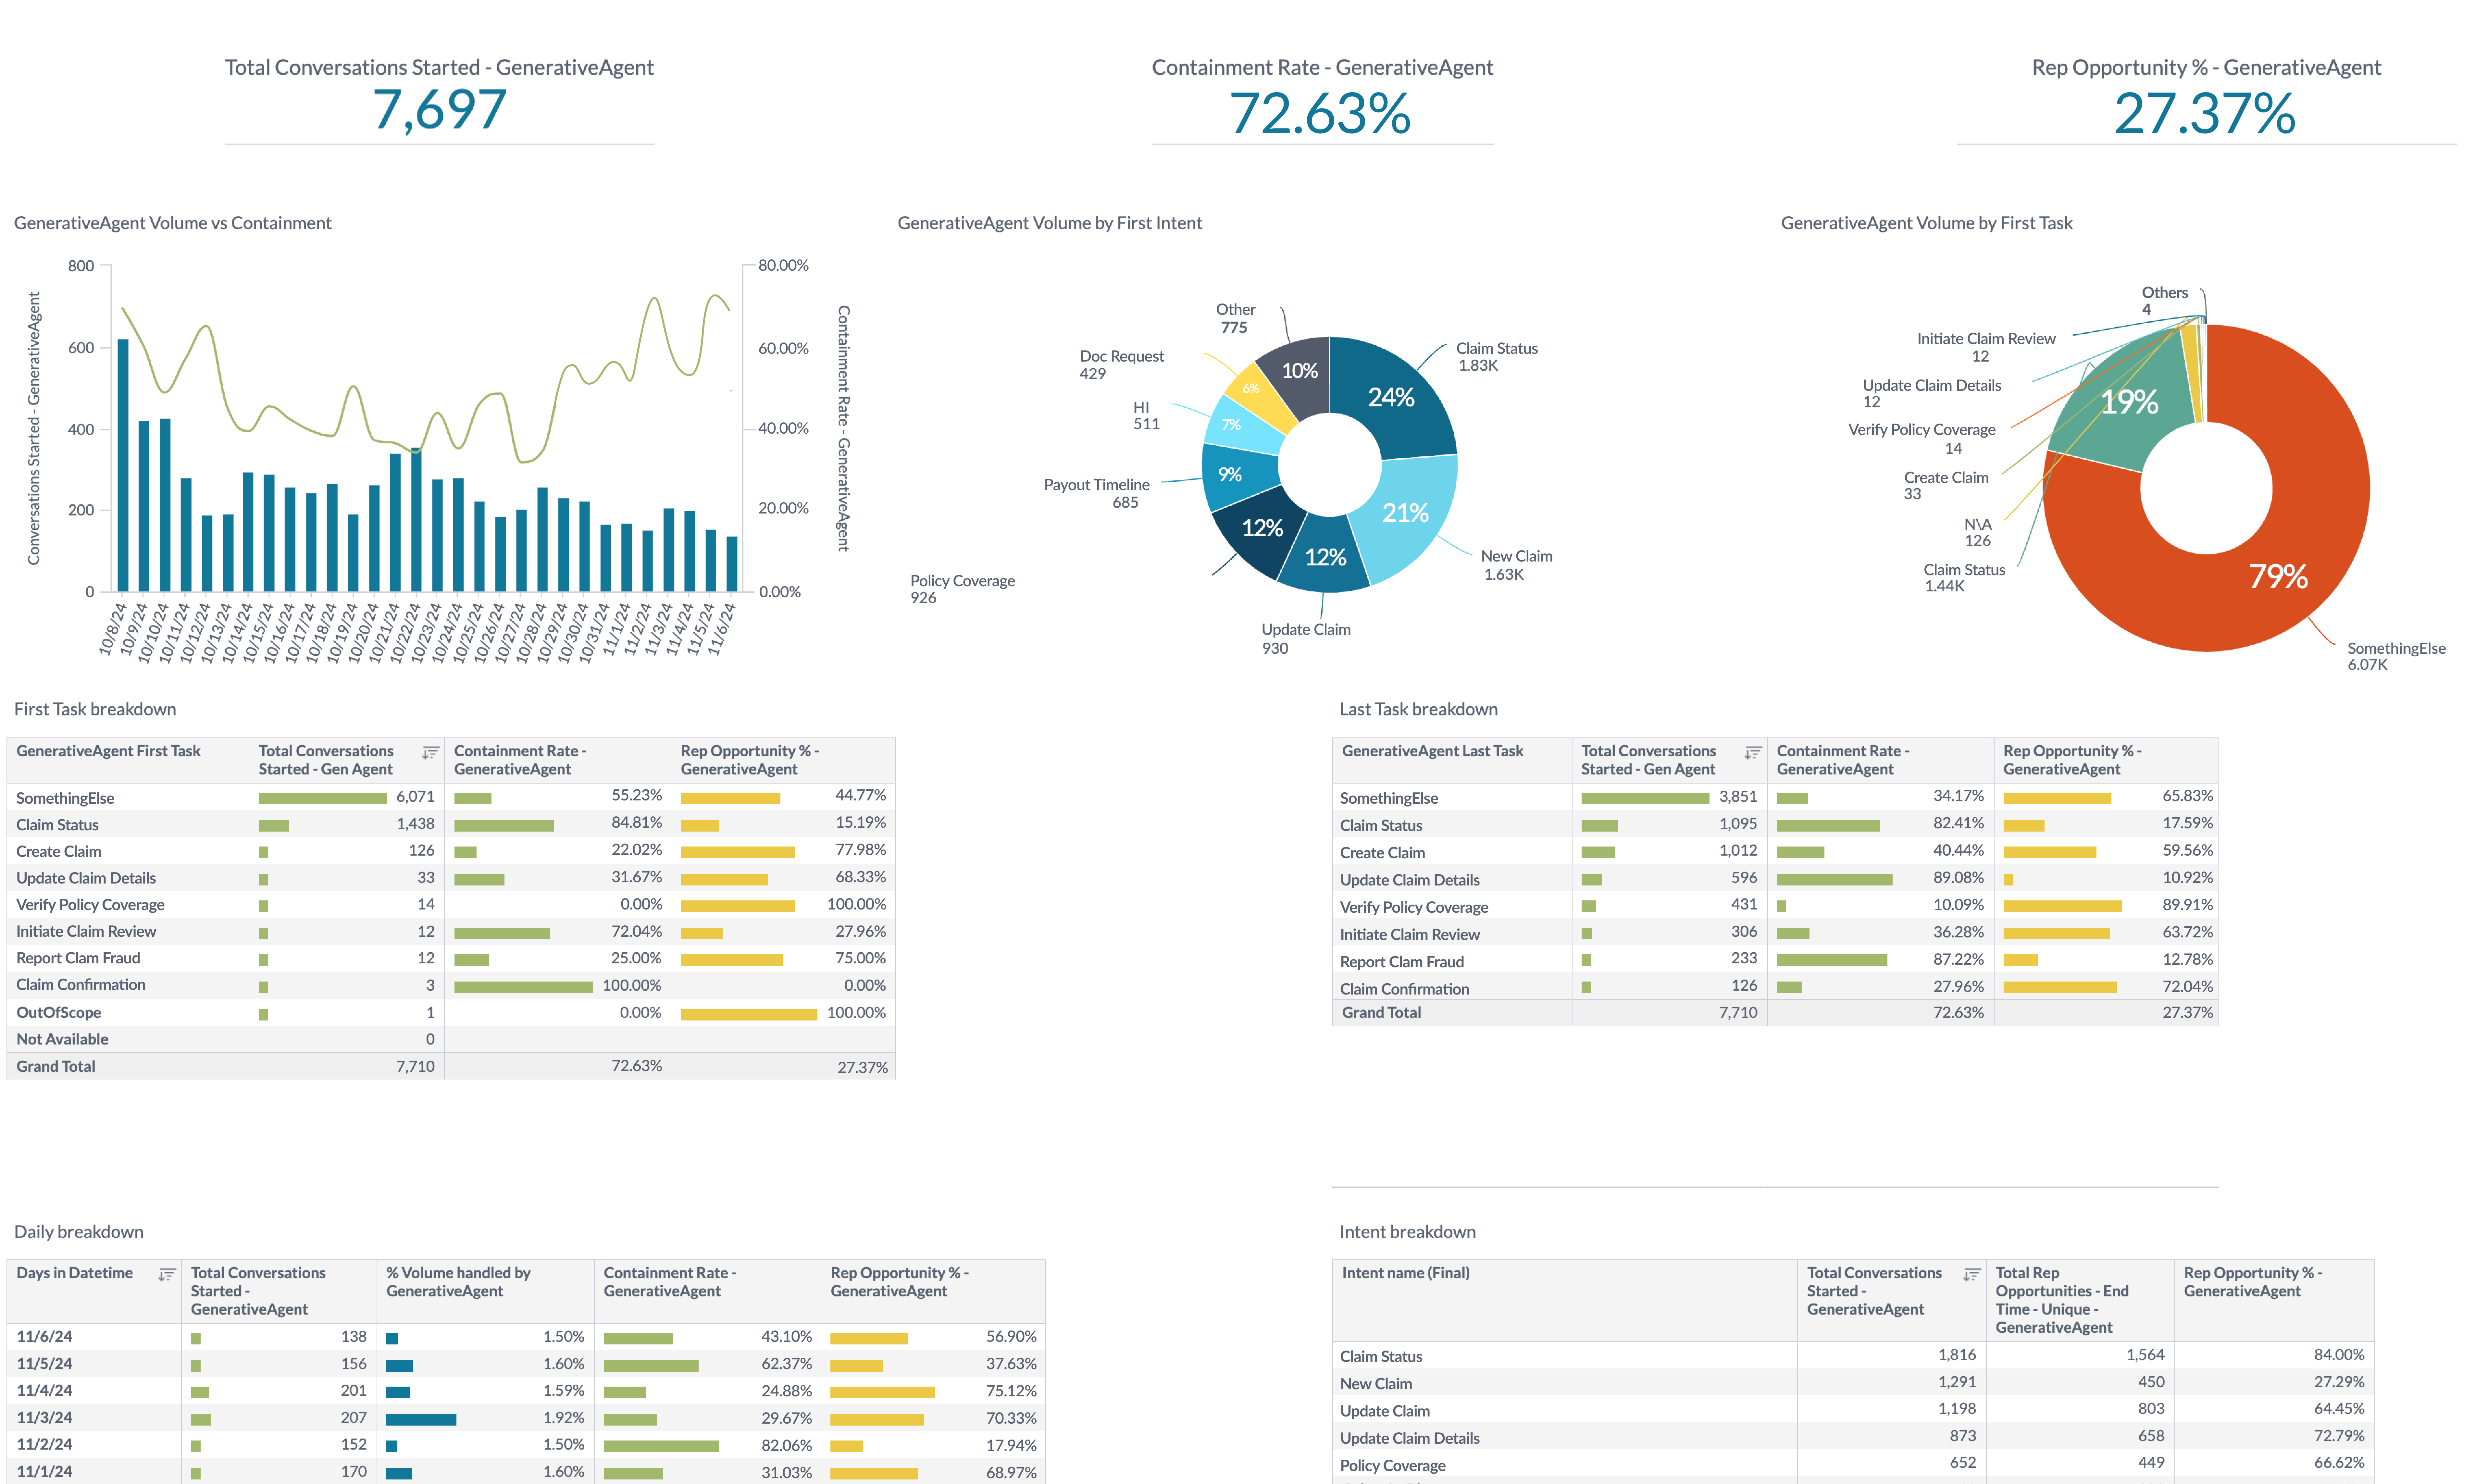
The fastest way to start monitoring GenerativeAgent is through our pre-built dashboards. To access them depends on whether you are using ASAPP Messaging or running GenerativeAgent standalone. These dashboards show you:- Volume and containment over time
- Containment by task
- Intent and task breakdowns
We only provide out-of-the-box dashboards for GenerativeAgent running on ASAPP Messaging.
- Navigate to ASAPP Core Digital Dashboards -> Automation & Flow -> GenerativeAgent
- Select GenerativeAgent Quality Metrics
Data feeds
For deeper analysis, or to integrate GenerativeAgent metrics with your existing analytics infrastructure, you can pipe GenerativeAgent’s data directly into your system using:- File Exporter APIs for standalone GenerativeAgent.
- Download from S3 if you are using our Messaging Platform.
- Combine GenerativeAgent metrics with other customer journey data
- Build custom dashboards in your BI tools
- Perform advanced analytics across channels
- Track end-to-end customer interactions
- File Exporter
- Download from S3
Use File Exporter to export data from a standalone GenerativeAgent. When exporting data via the File Exporter APIs, you need to specify a Refer to the File Exporter documentation for more details on the listing and retrieving files.
feed of generativeagent.The system generates reports hourly.Here is an example to get a list of files in the generativeagent feed for a given day:GenerativeAgent data schema
Data Reference
See all available metrics and their definitions in our data reference guide