- Monitor all queues
- Monitor alerts
- Drill down into each queue to gain insight into what areas need attention
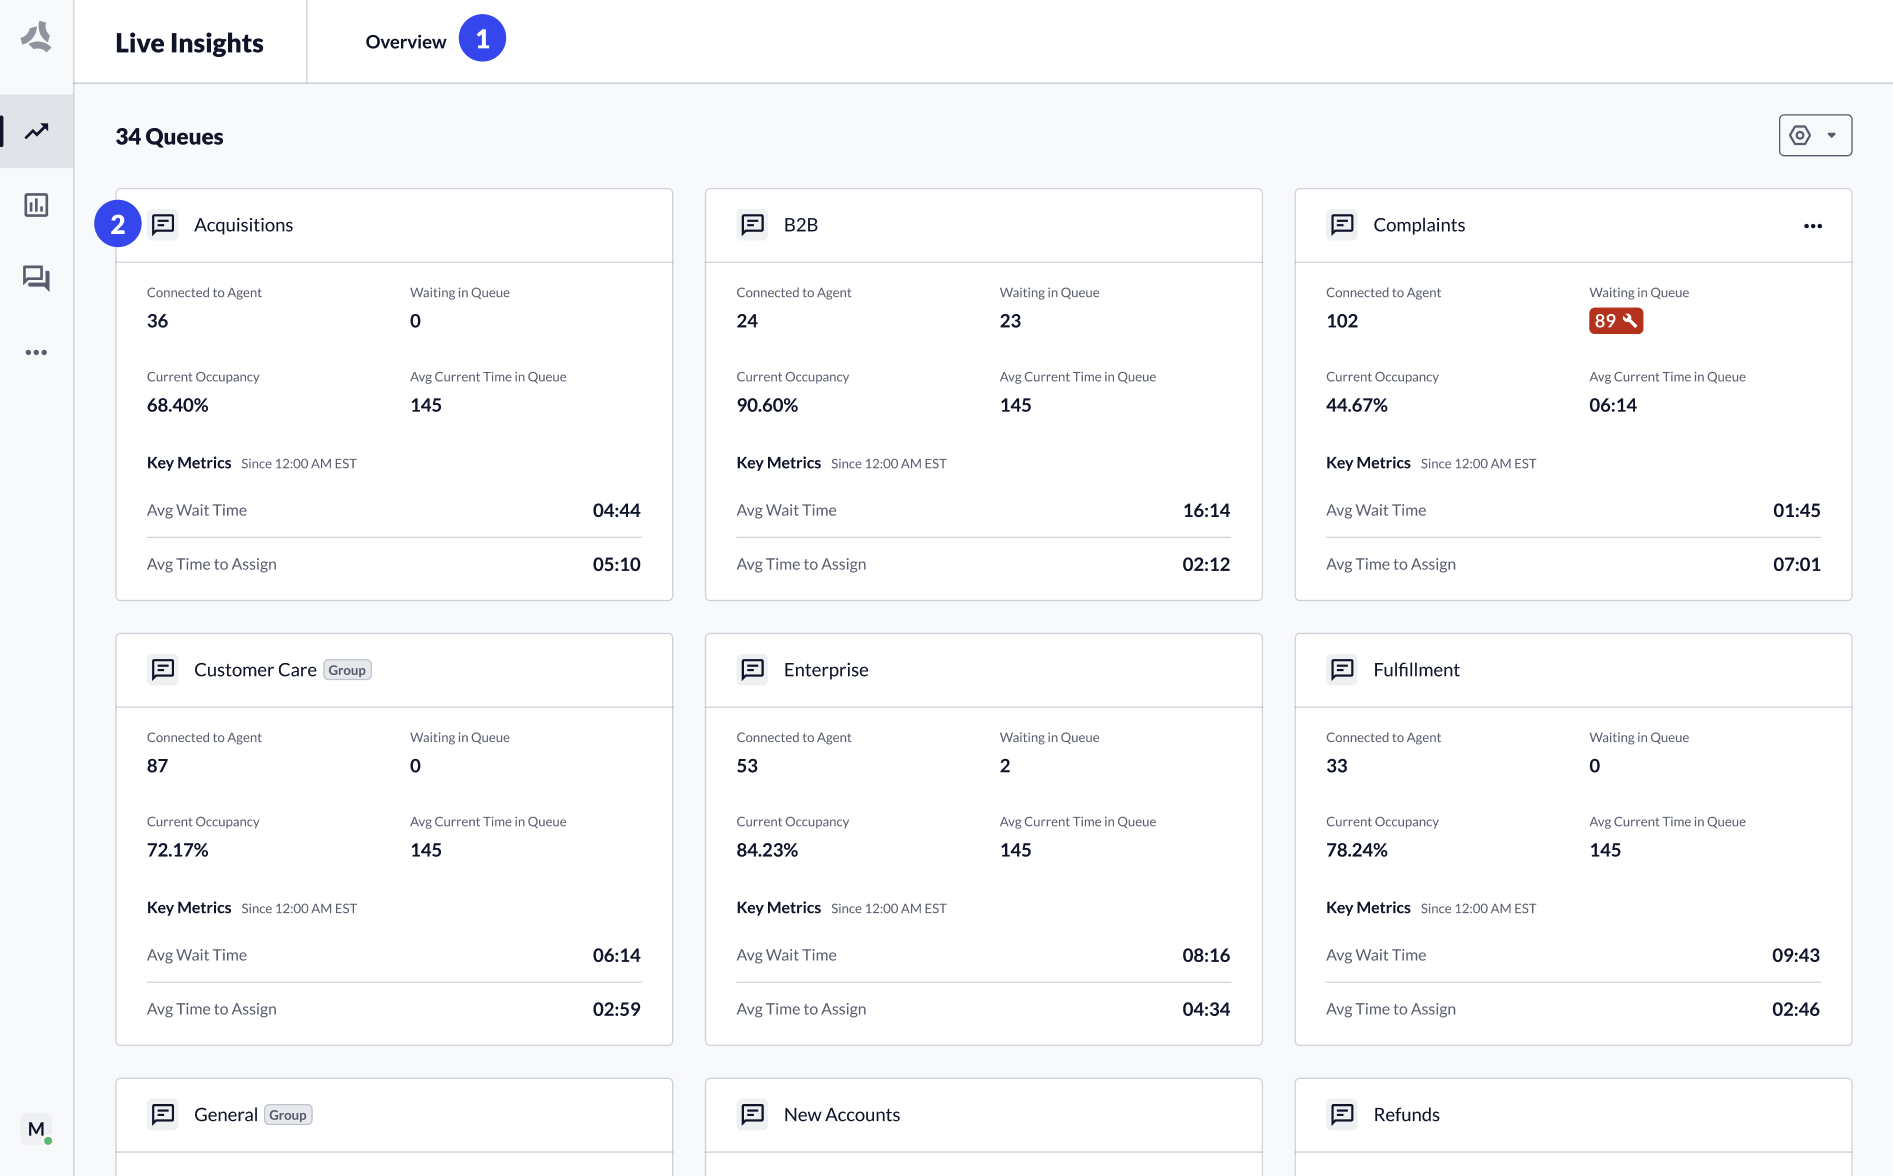
- The Overview page (All Queues) shows a summary widget for each configured queue.
- Click a queue tile or select a queue from the header dropdown to navigate to the Queue Details page.
Monitor Performance per Queue
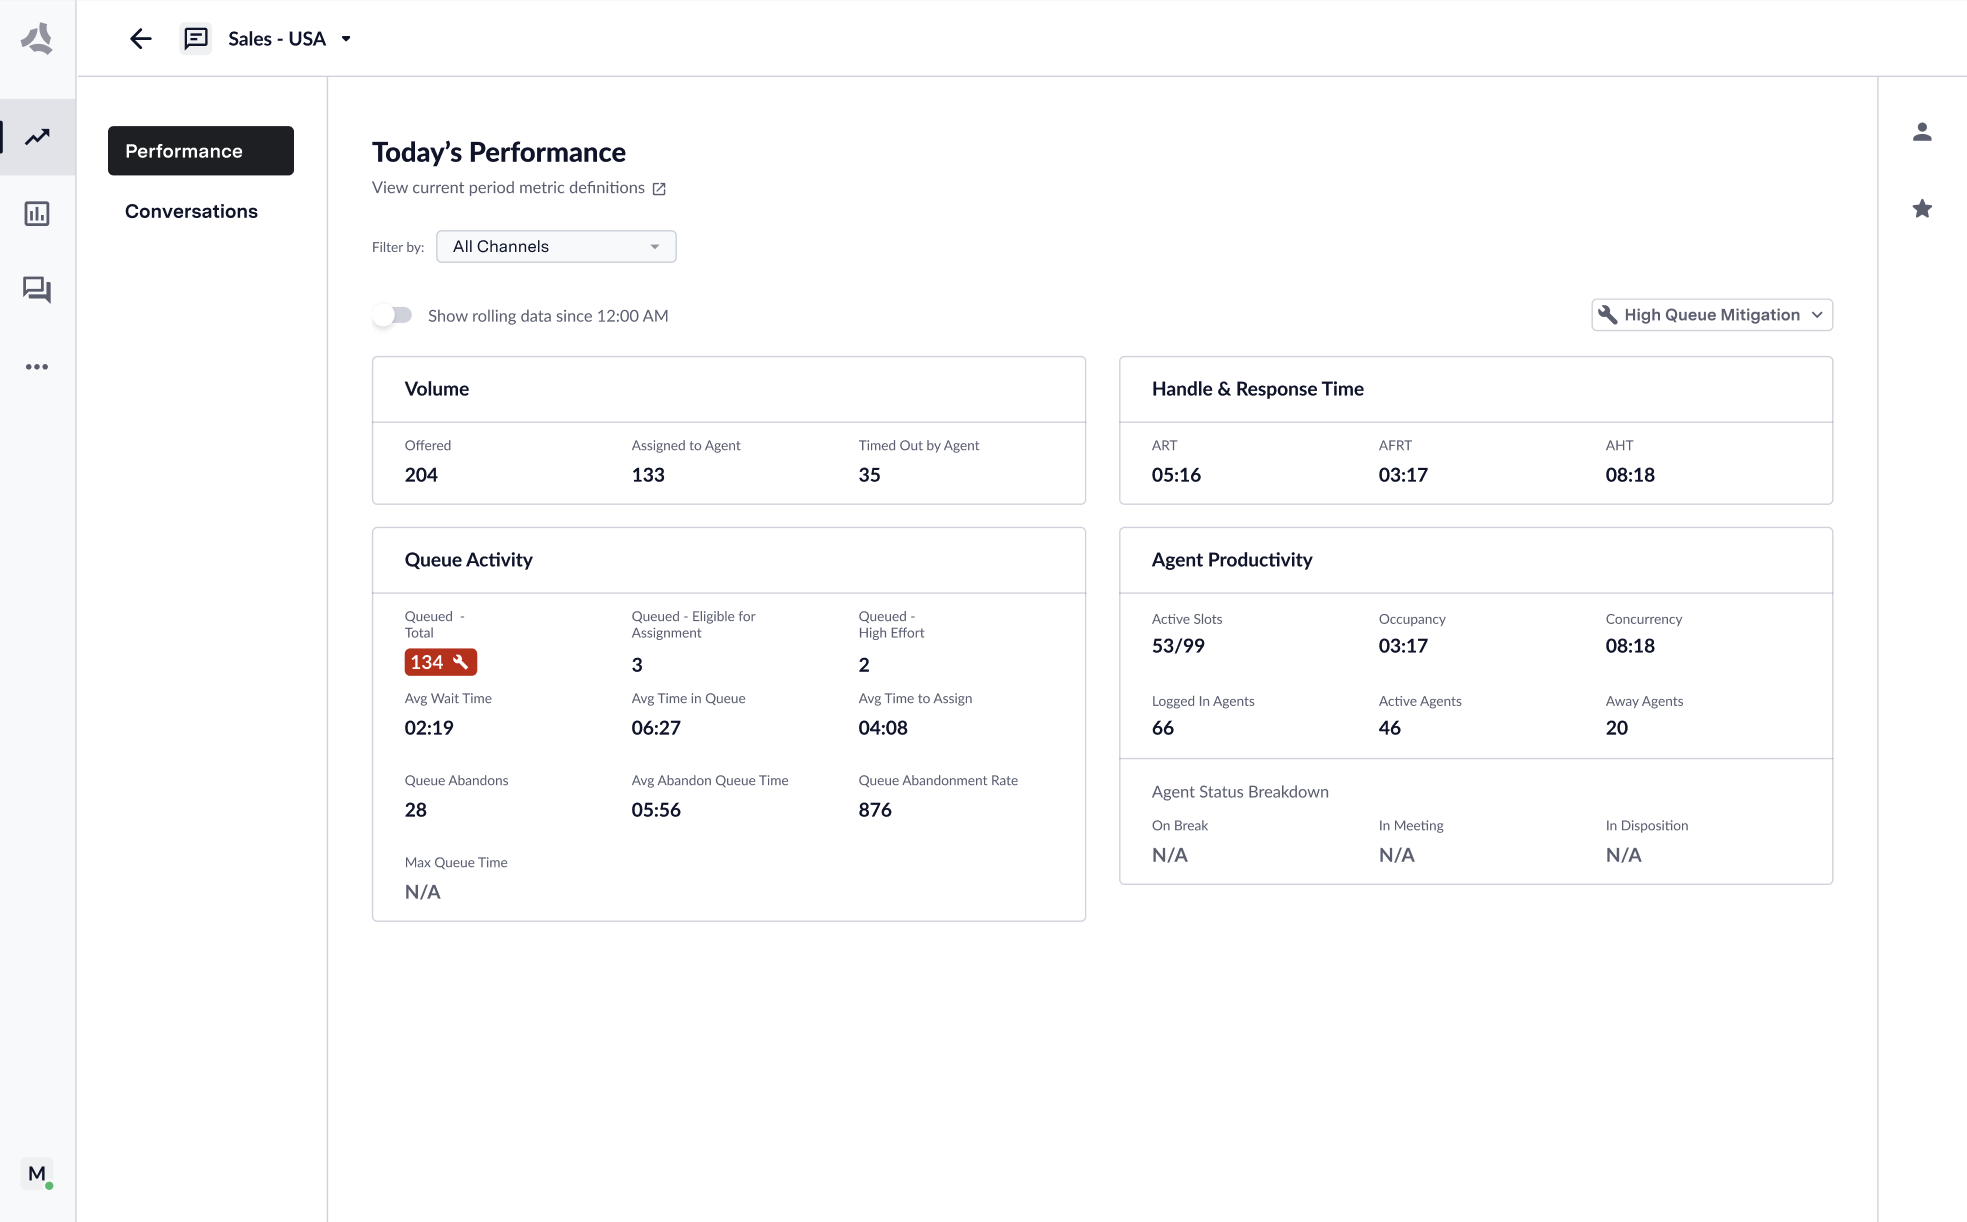
The Queue Details page for each queue shows performance across the most important metrics. All metrics that the dashboard displays update in true real time. You can categorize metrics either as “Right Now” or “Current Period”:- Right Now metrics update immediately upon a change in the ecosystem.
- Current Period metrics will constantly update in aggregate over the day.
Information Architecture
ASAPP continues to improve the Live Insights experience with new touch points to host live transcripts and to scale up when introducing new metrics and performance signals.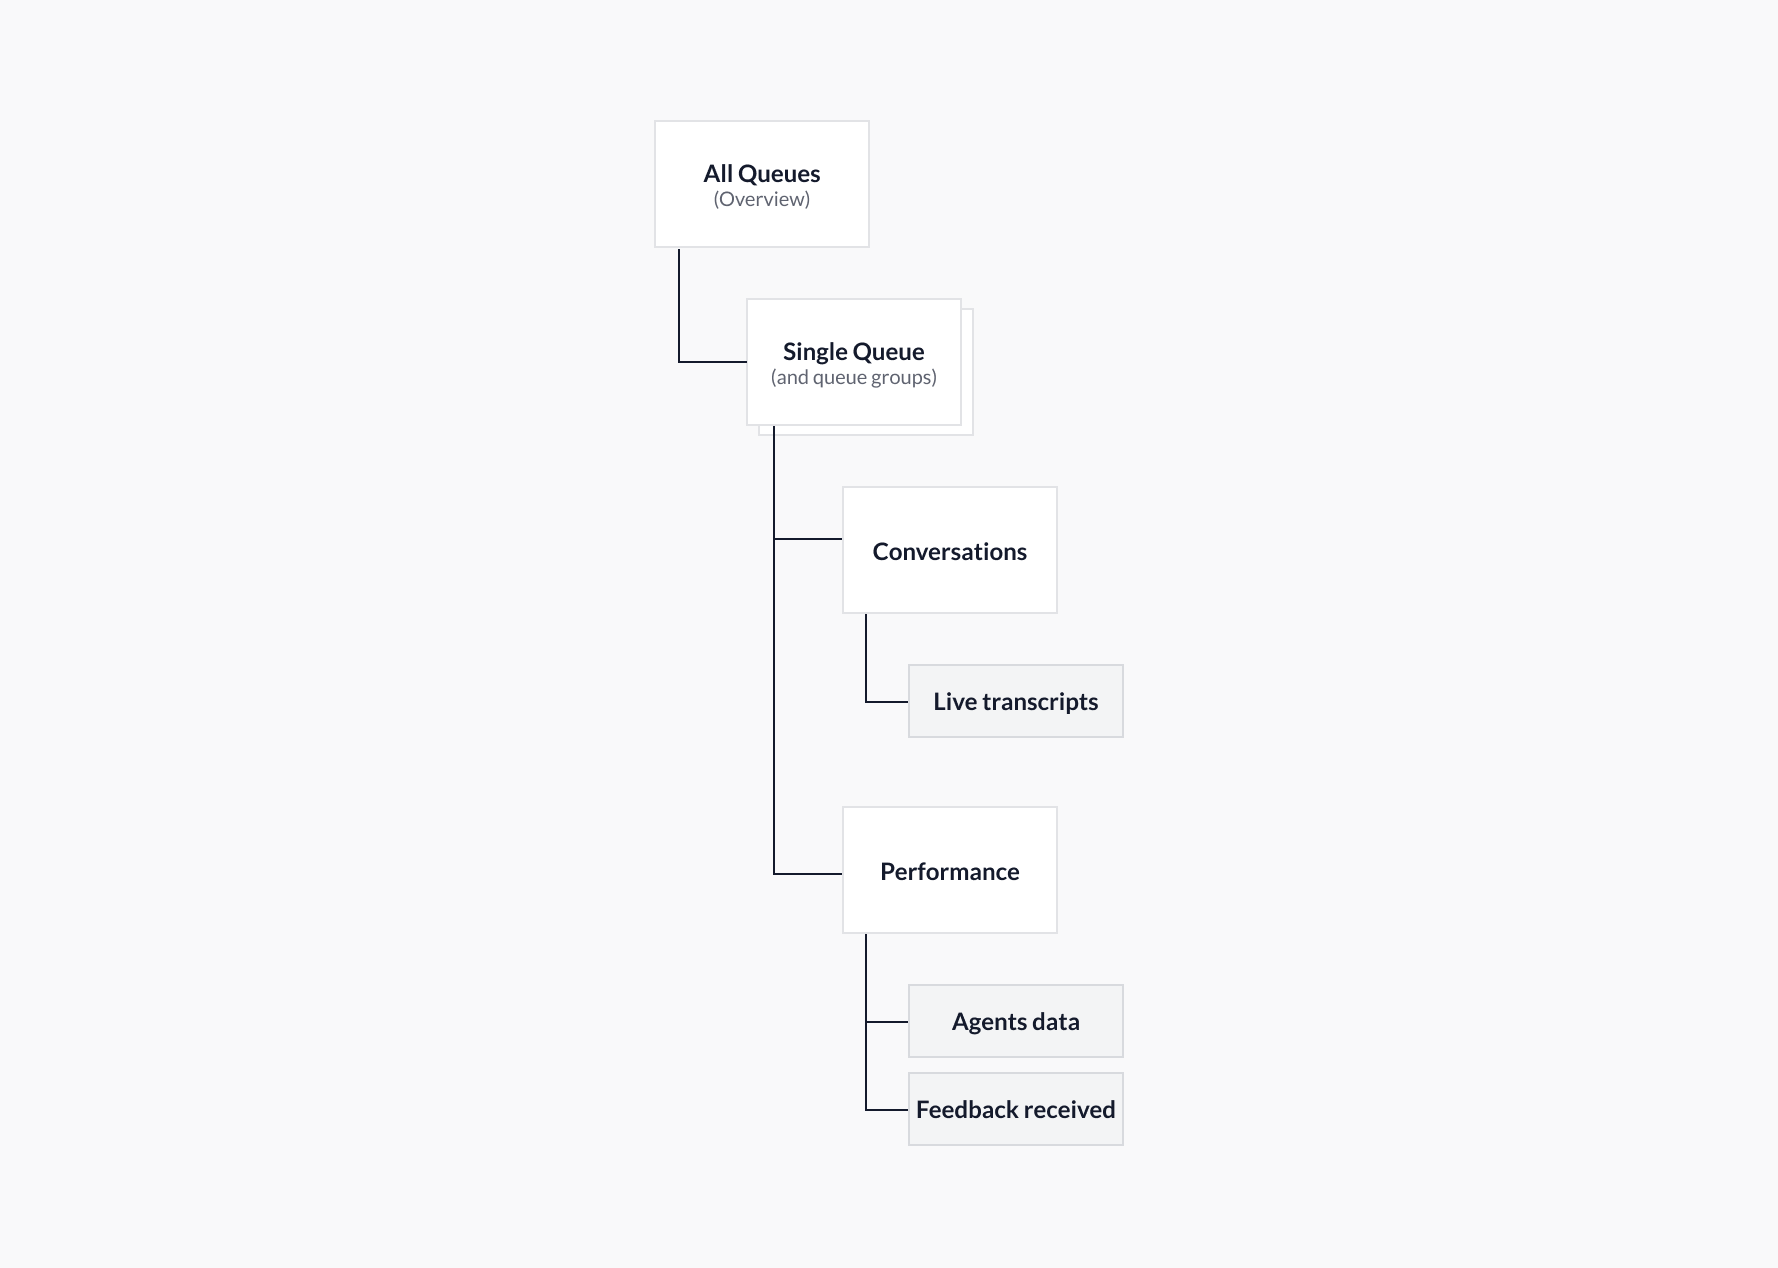
- All Queues → Provides a performance overview of all queues and queue groups. Also provides customization tools to show/hide queues and create/manage queue groups.
-
Single Queue and Queue Groups → These now include two pages:
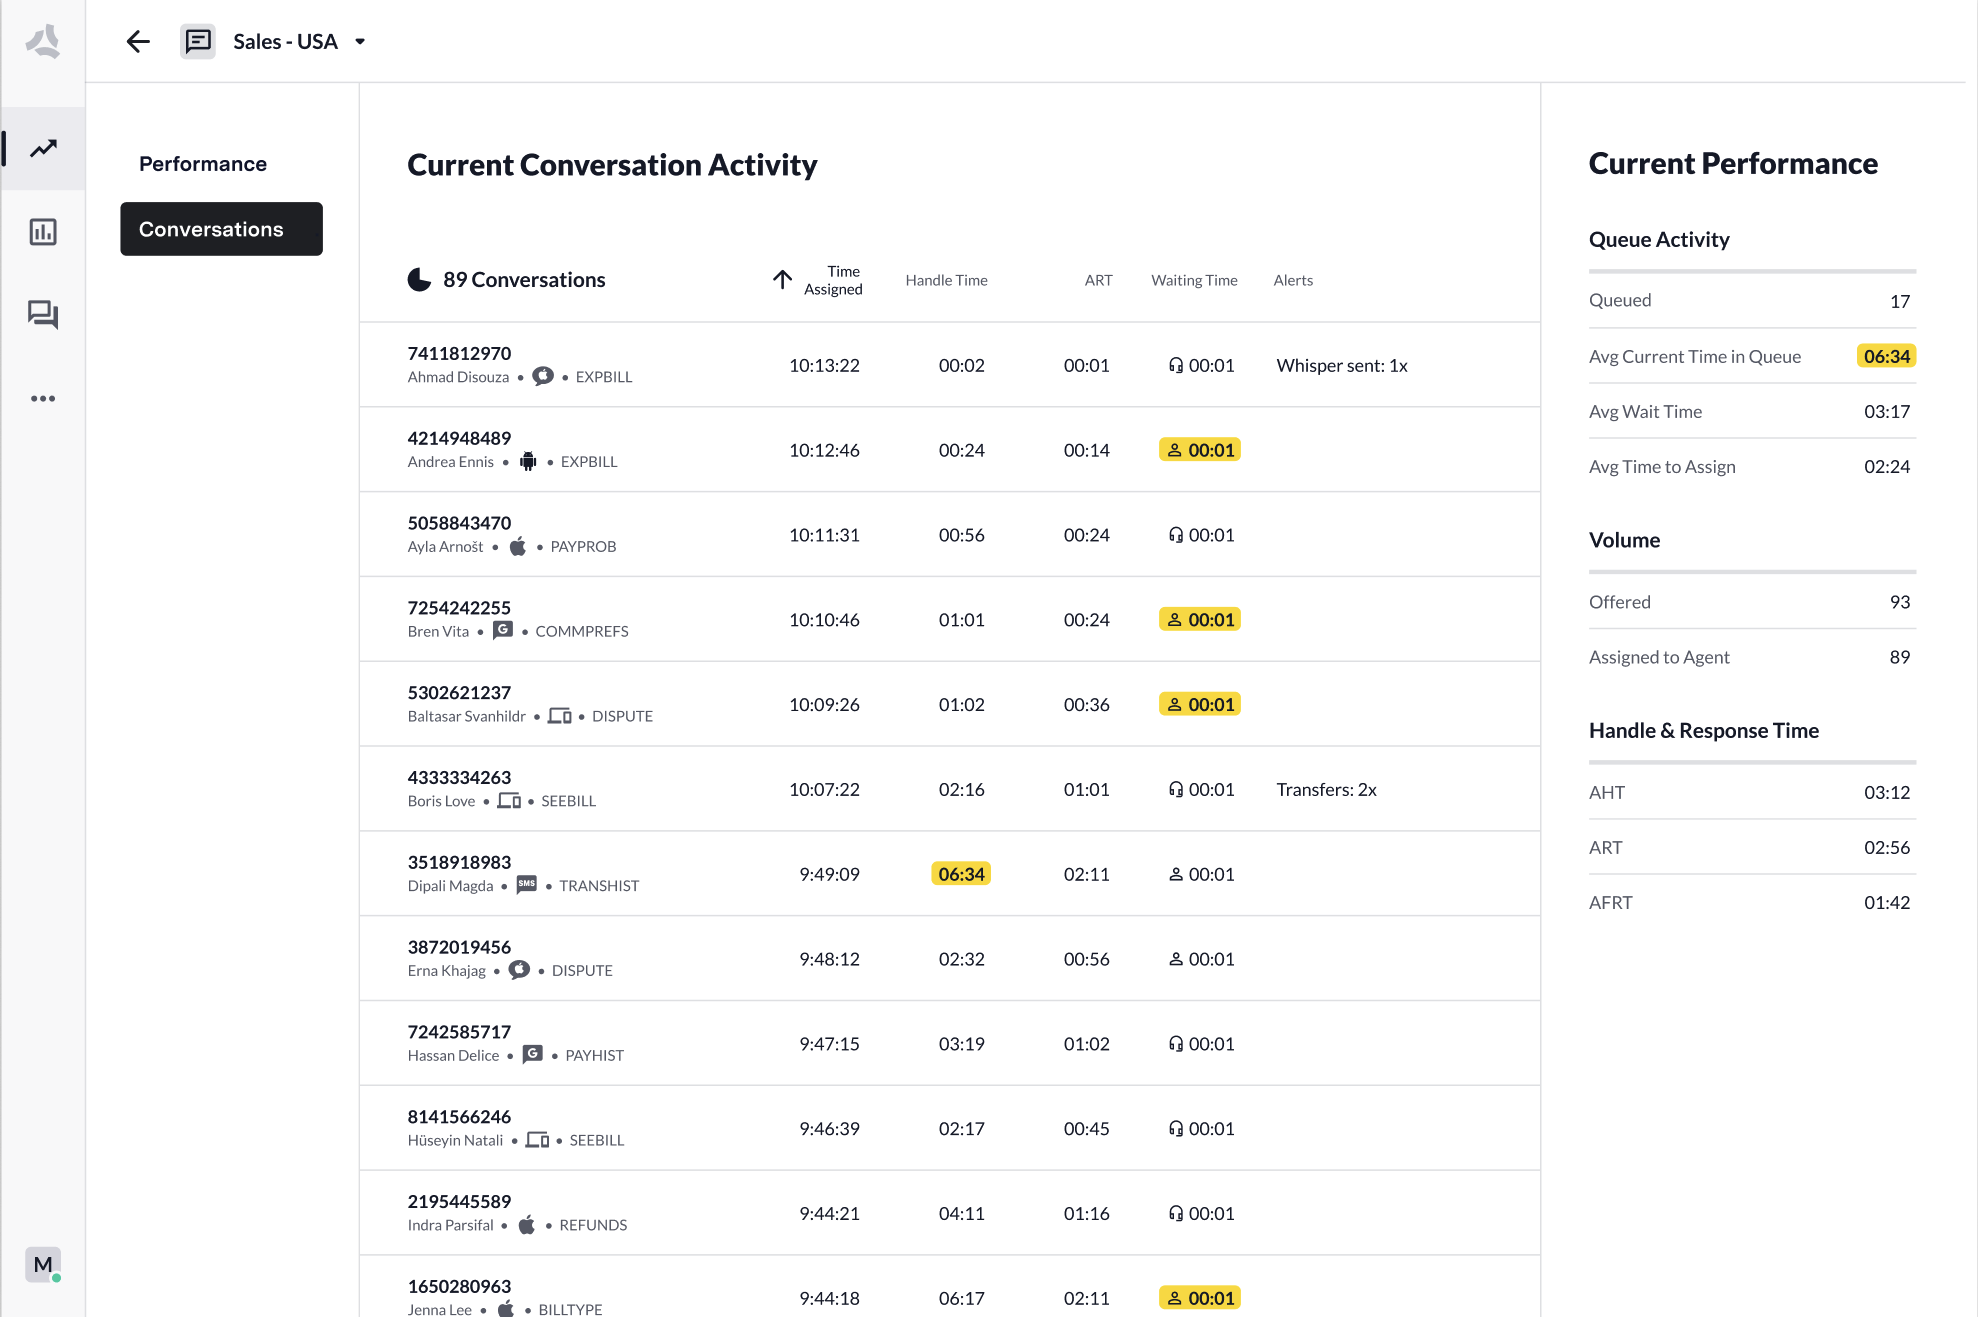
- Conversations: Displays performance data for all conversations currently connected to an agent, as well as live transcripts and alerts.
- Performance: Displays queue performance data, both for ‘right now’ and rolling ‘since 12 am’. It also provides agent performance data and showcases feedback that customers send.
Two Views: Conversations & Performance
- Conversations
- Performance